
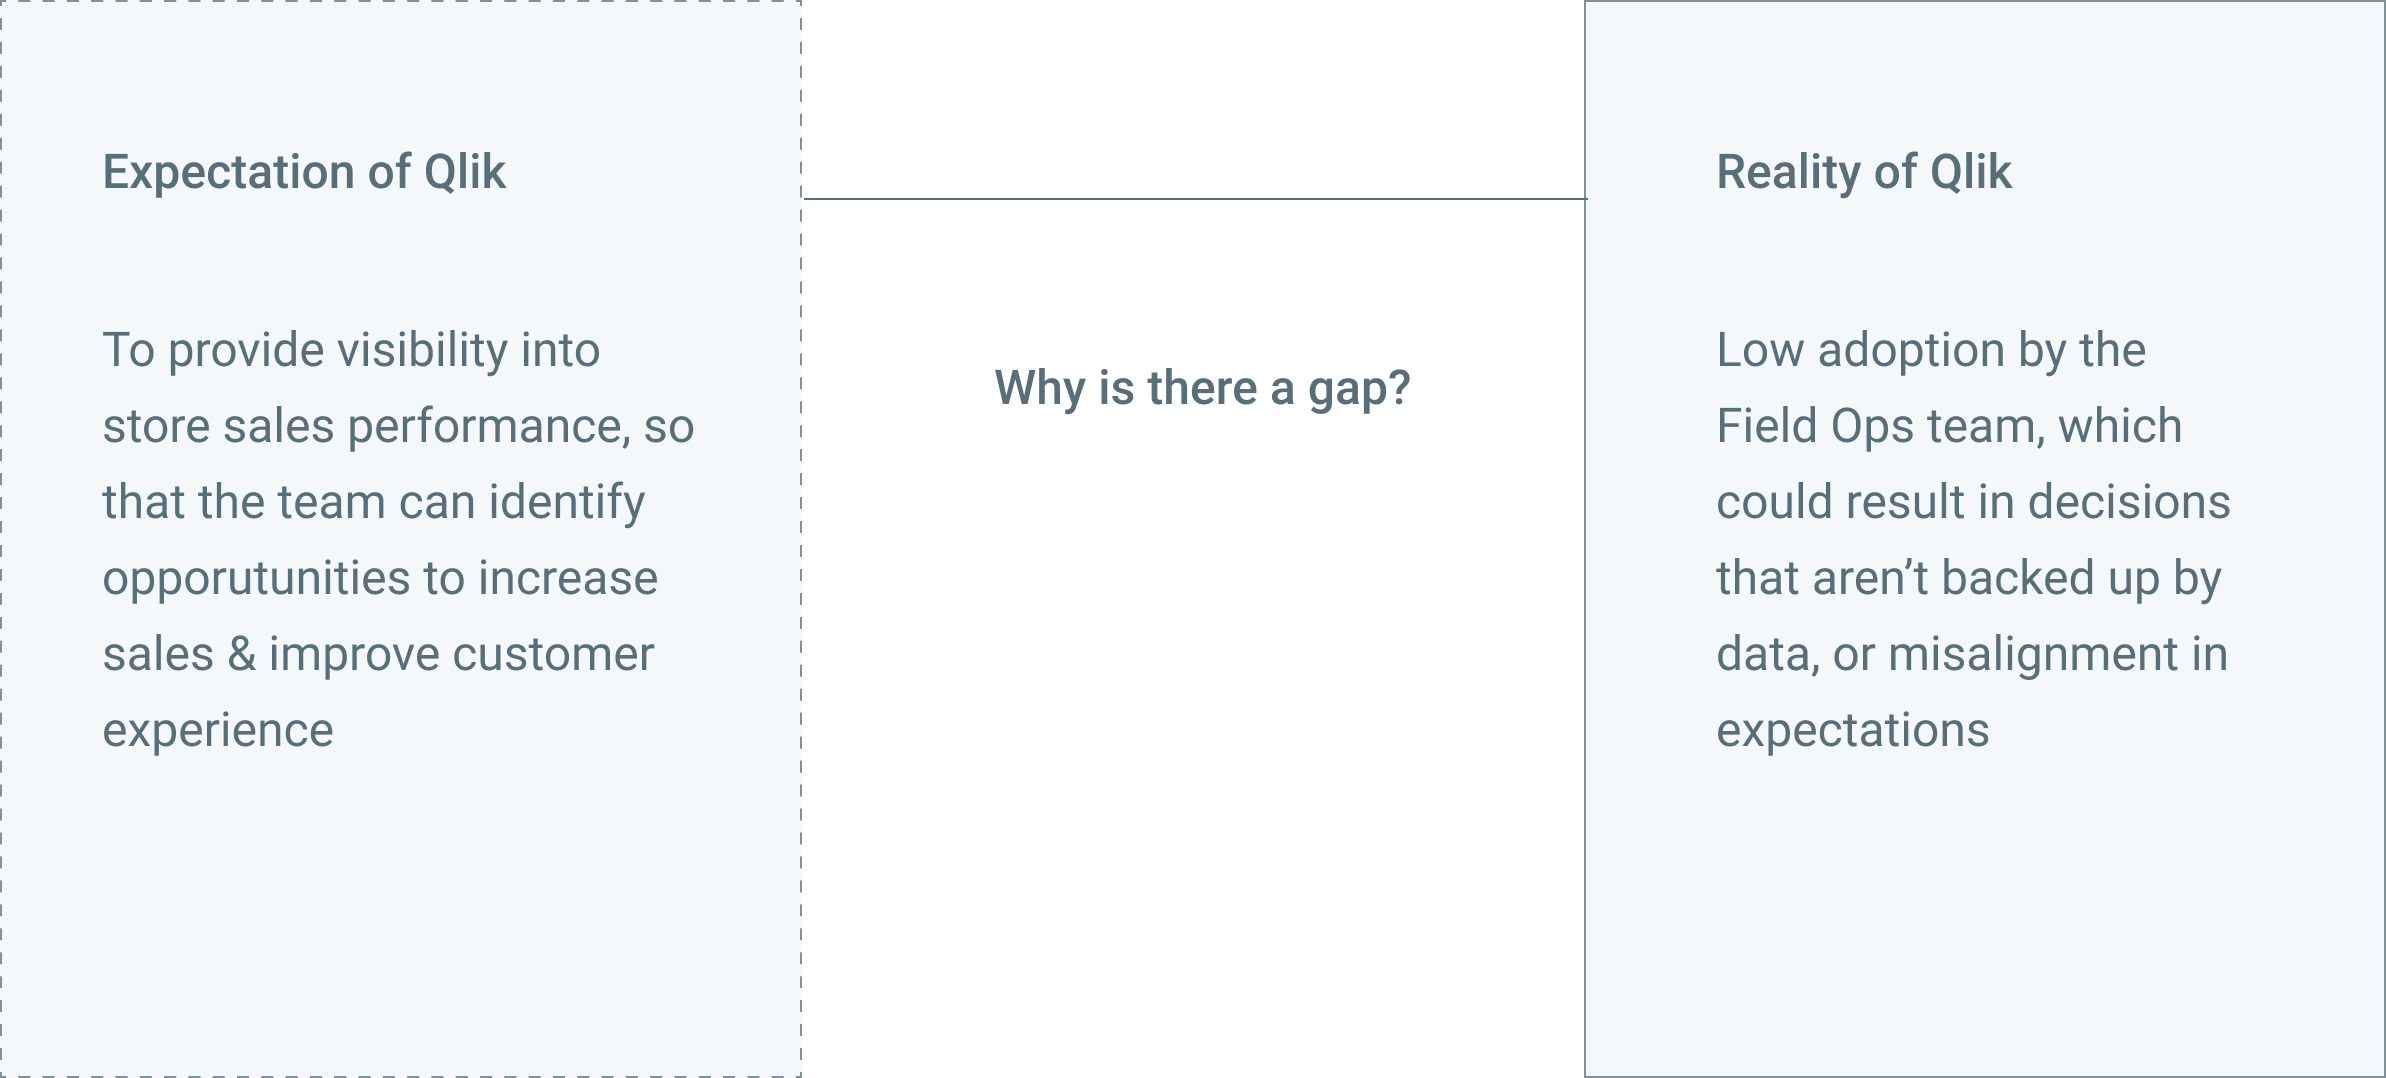
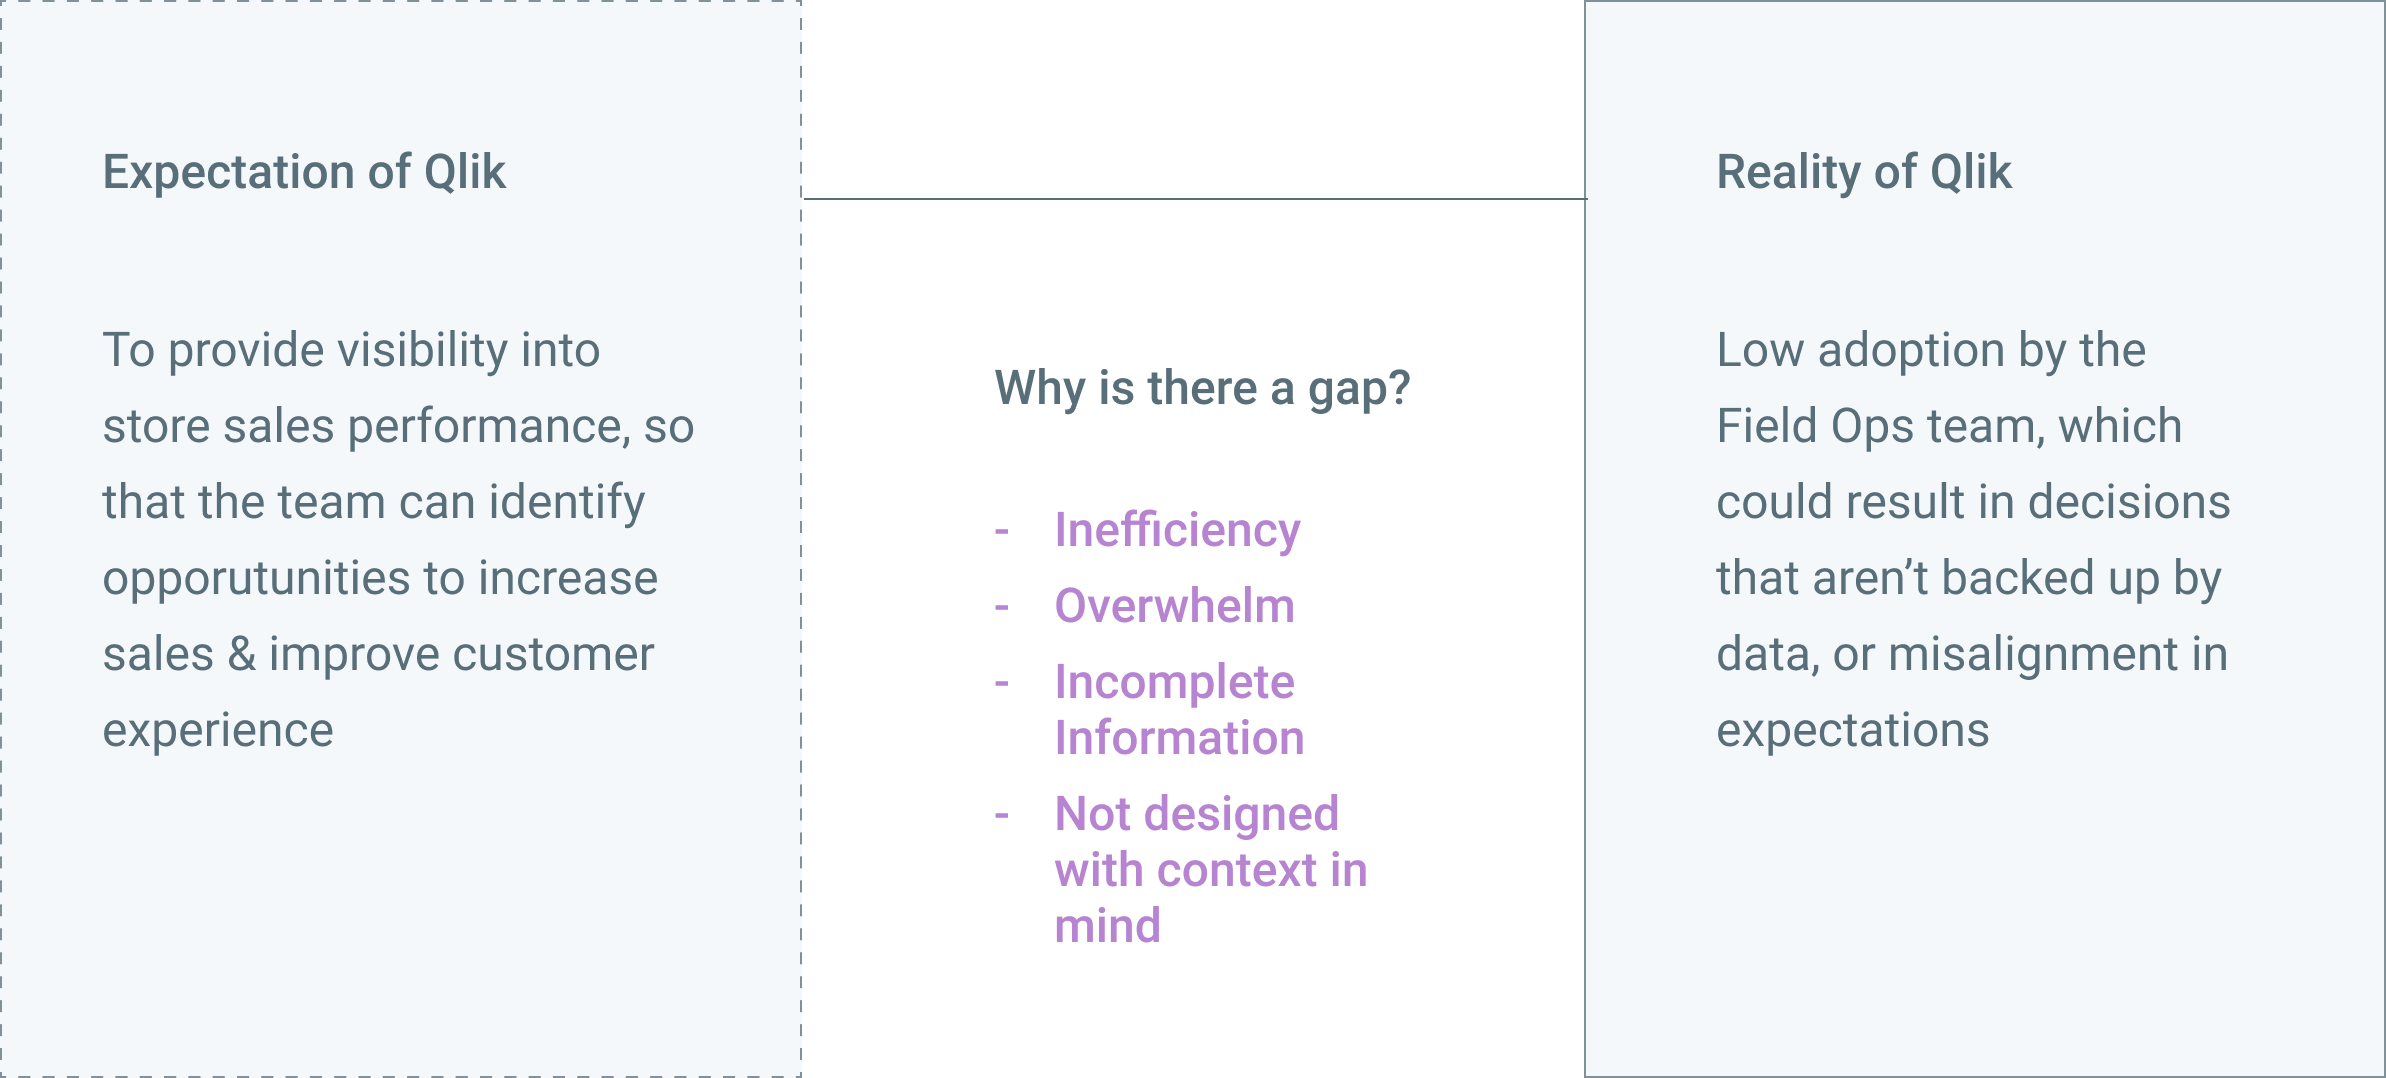
The Problem
Note: Qlik is an out-of-the-box dashboarding software.
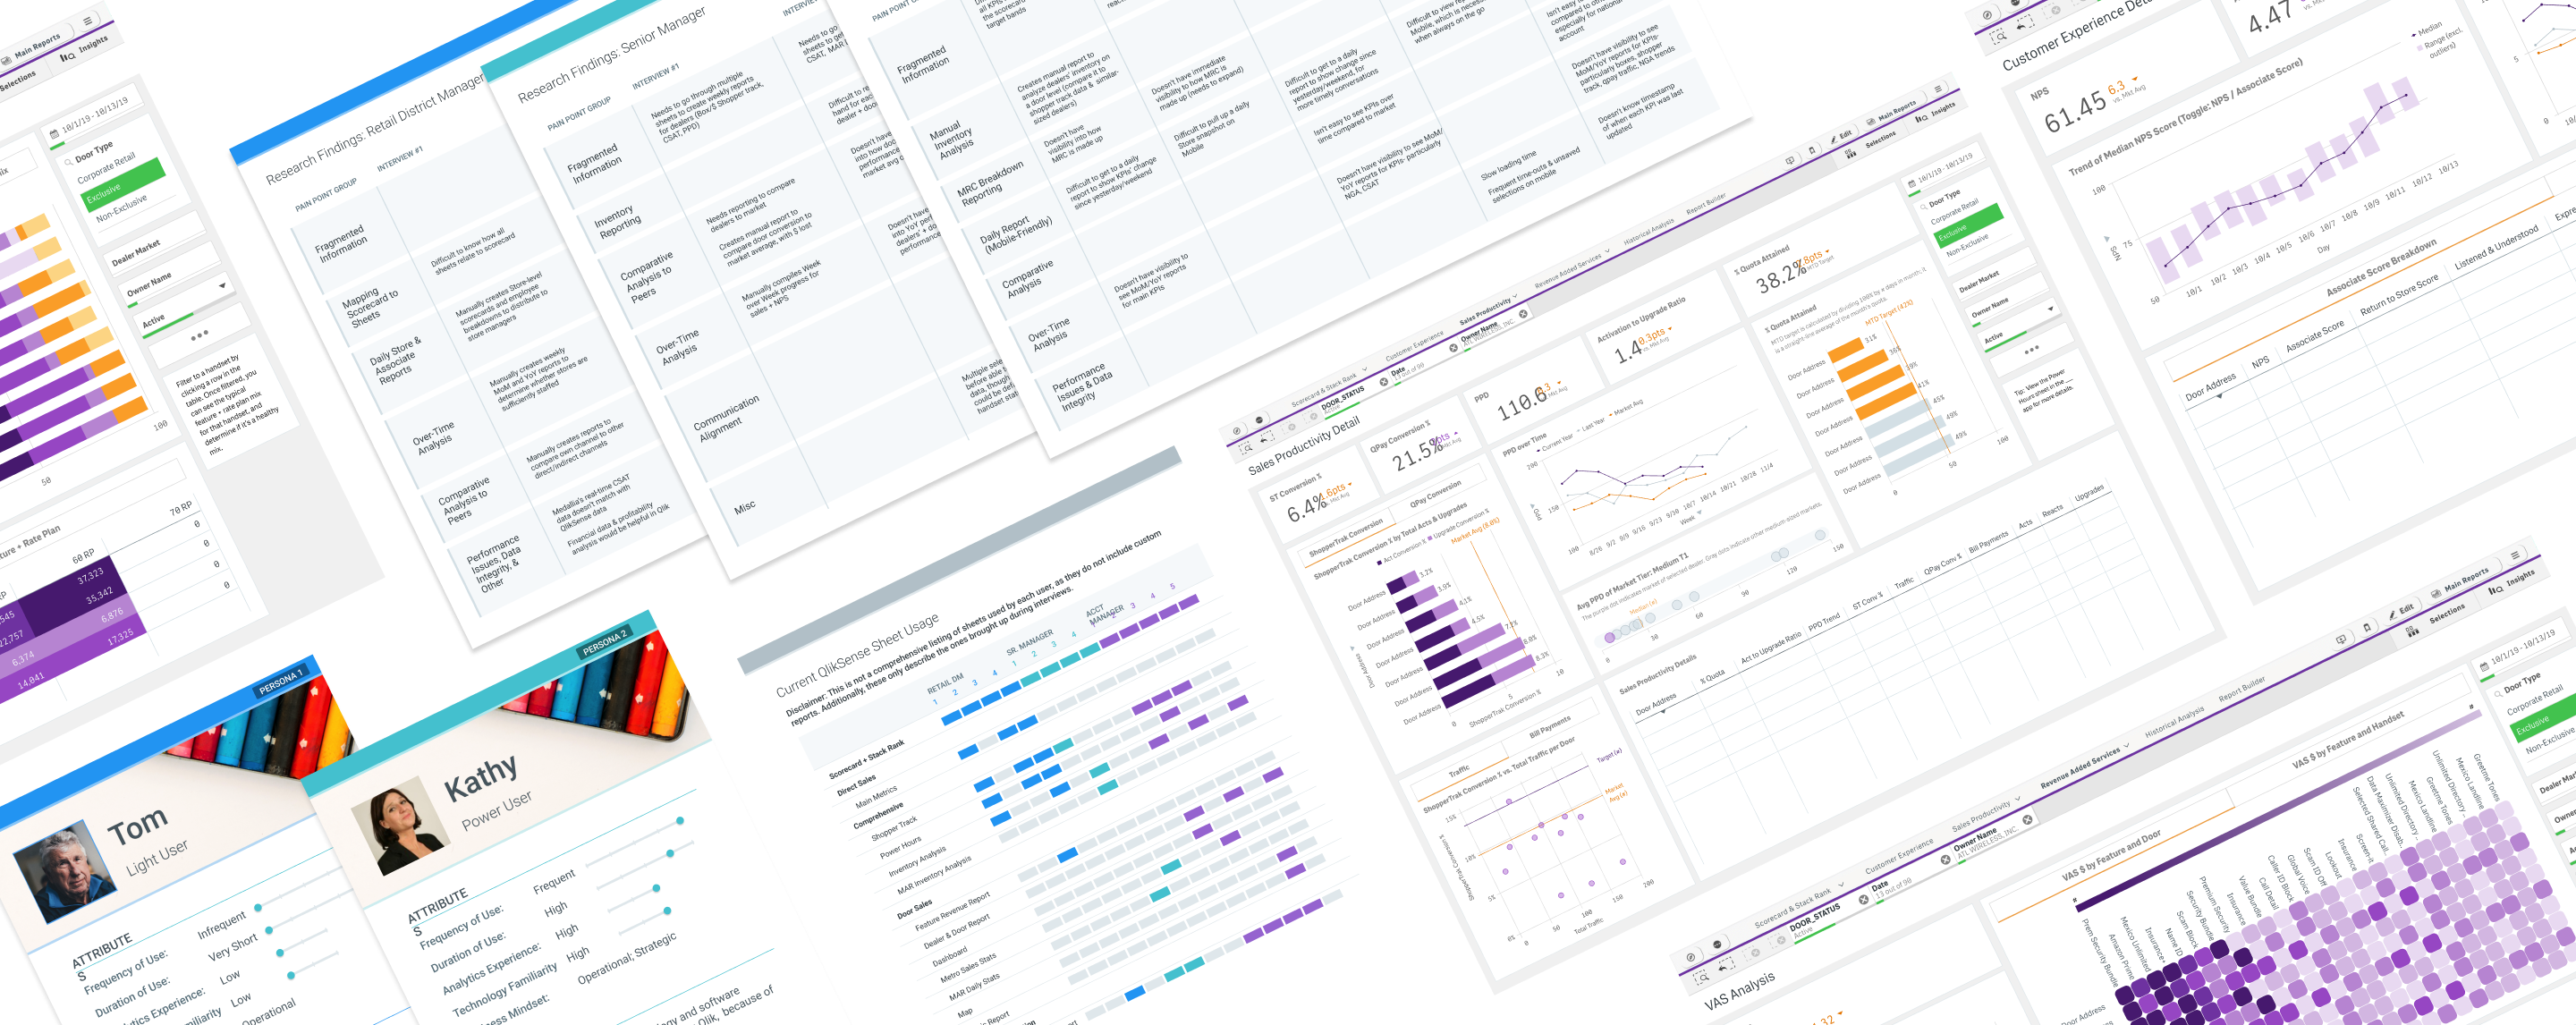
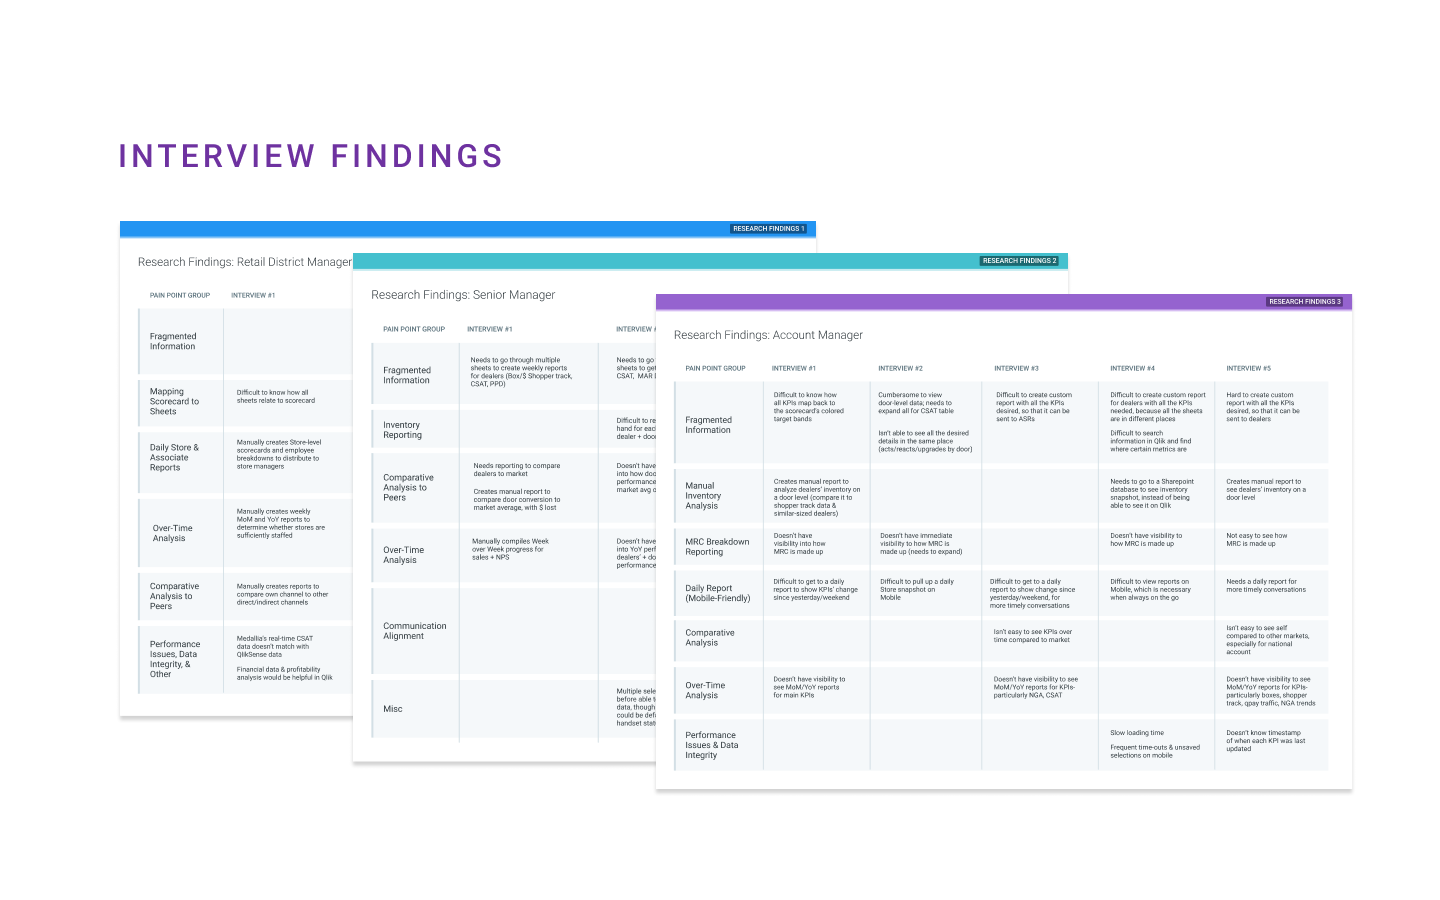
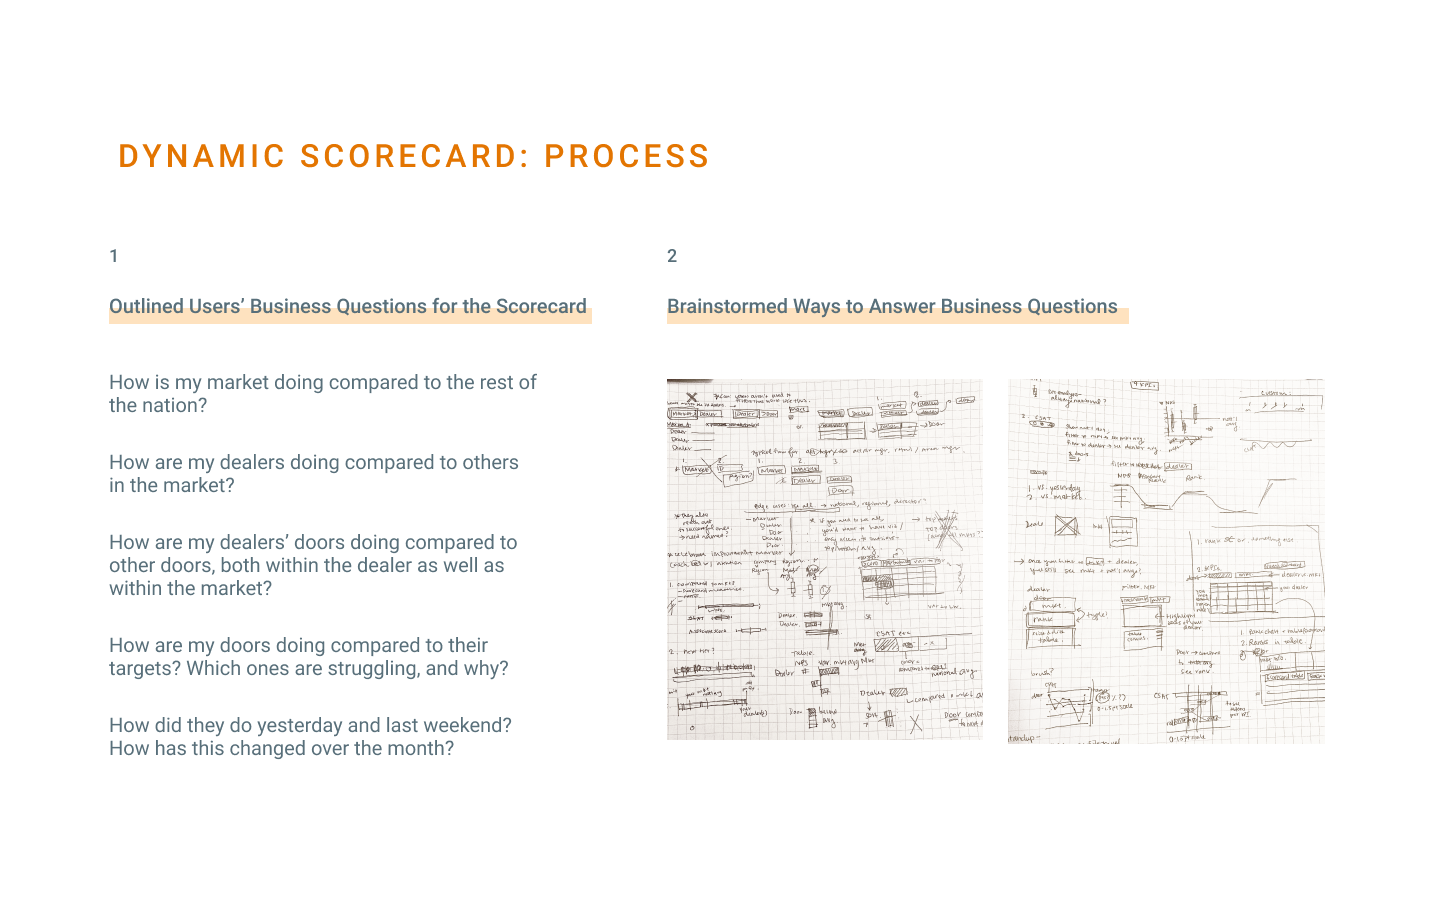
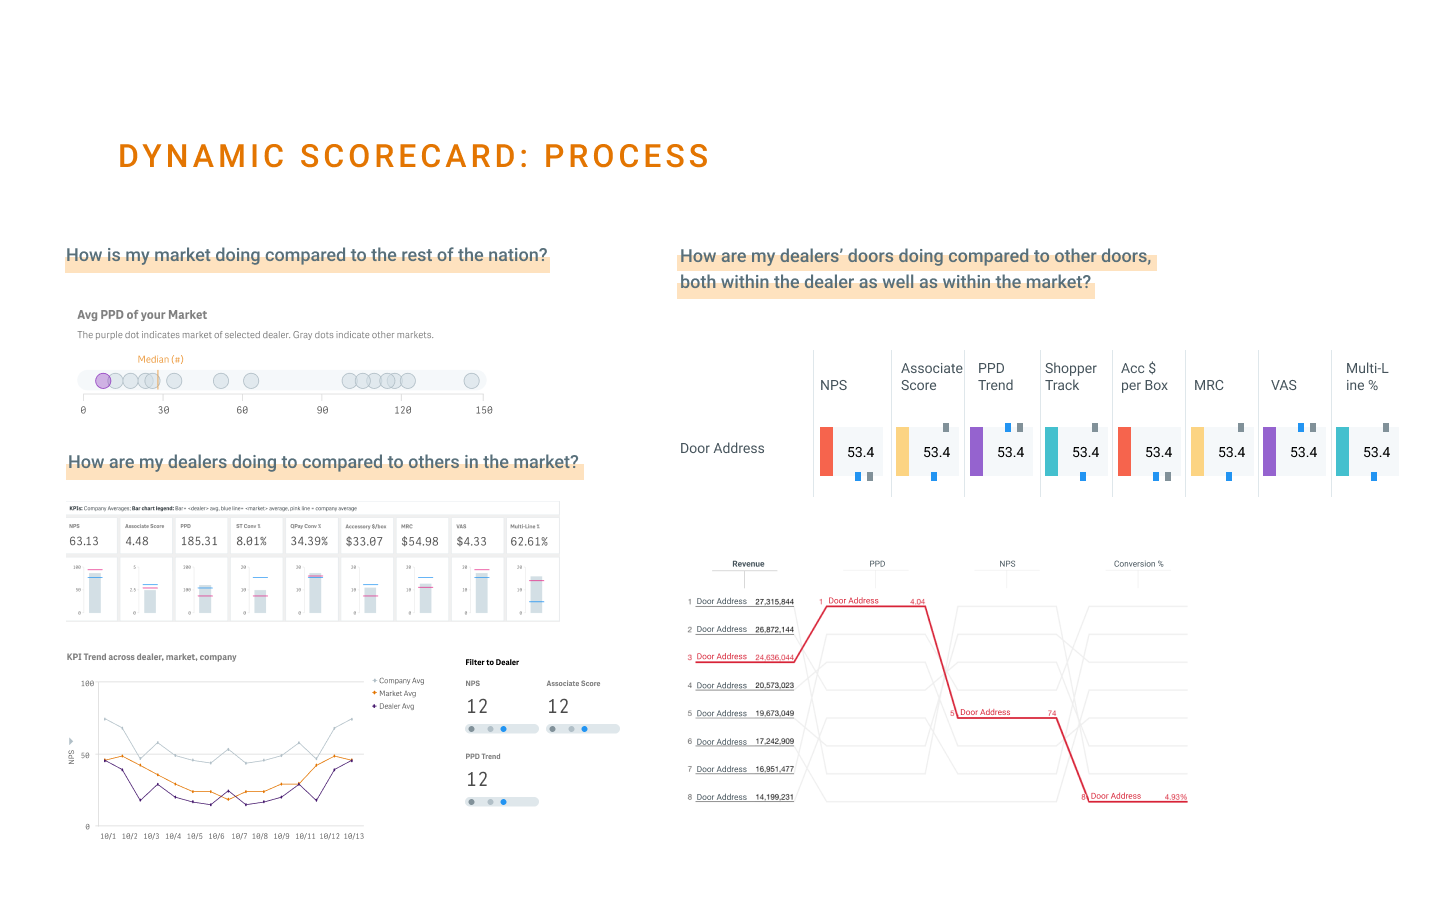
Research Activities
one
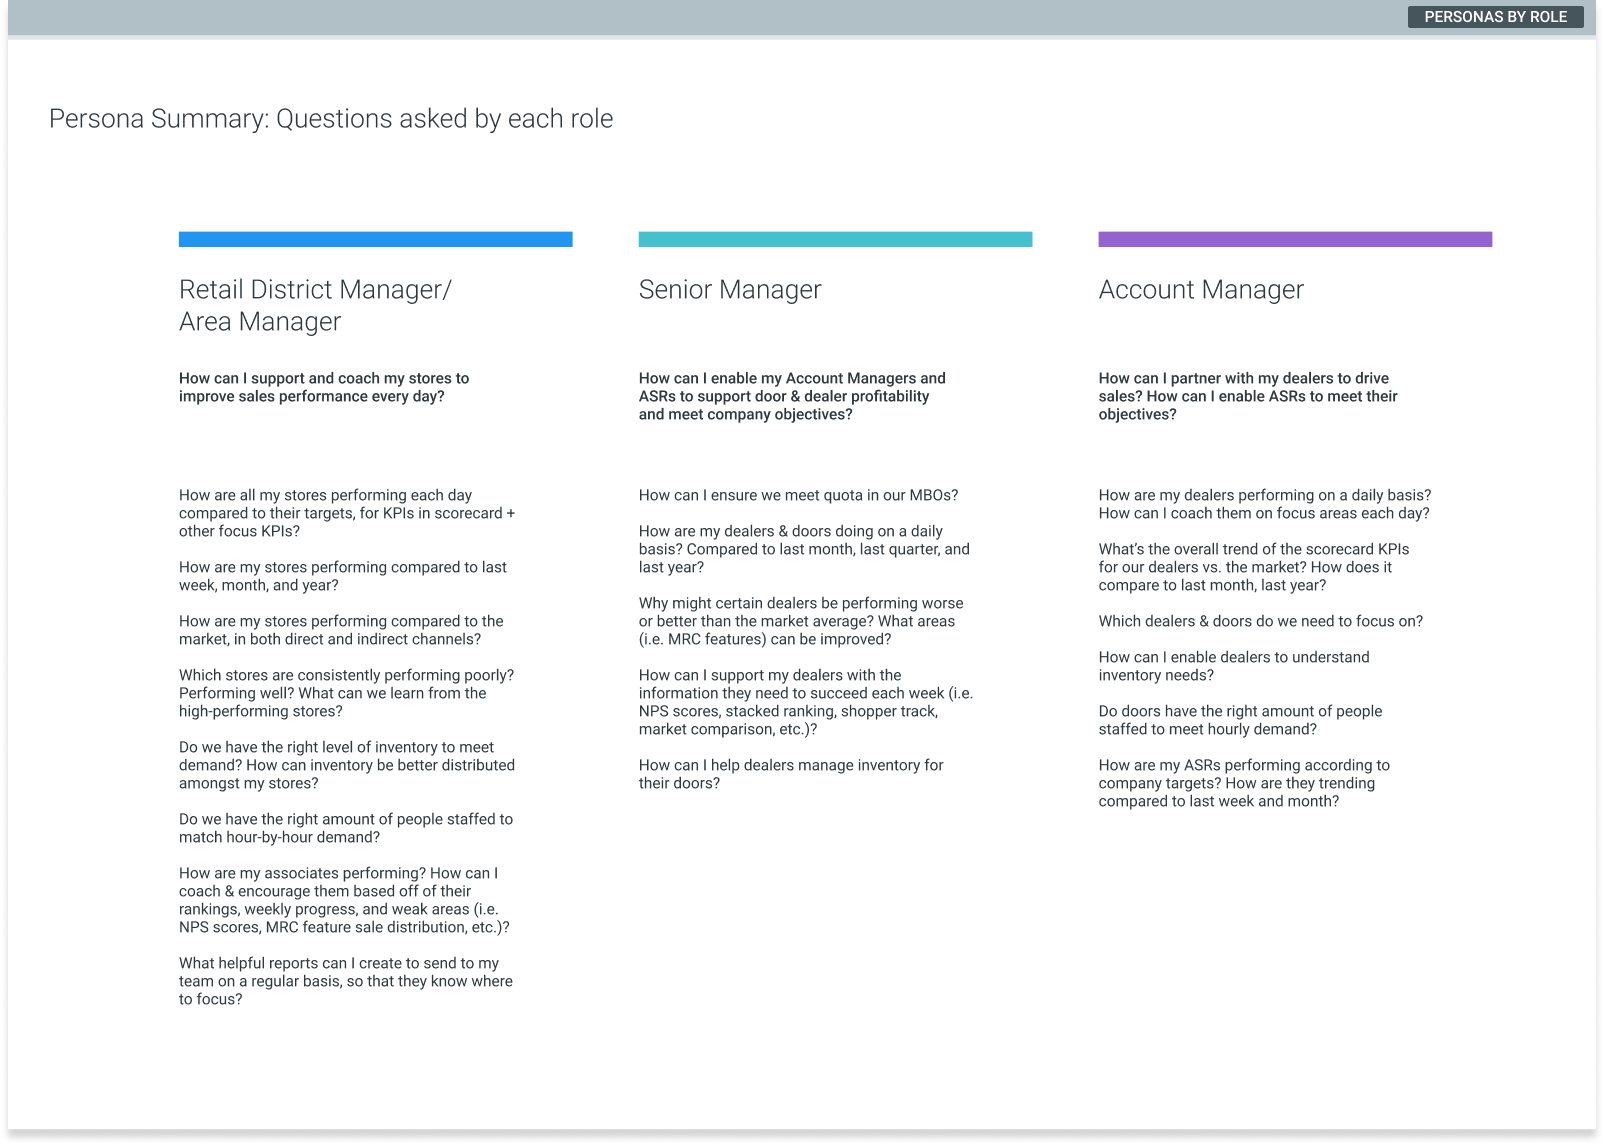
23 Interviews across 2 Channels & 6 Job Titles
Interview objectives:
`1. Learn about the differing goals and responsibilities of people in Field Ops
2. Understand how Qlik supports their goals and tasks
3. Observe how they’d normally use Qlik in a typical session
4. Identify pain points in the current process
two
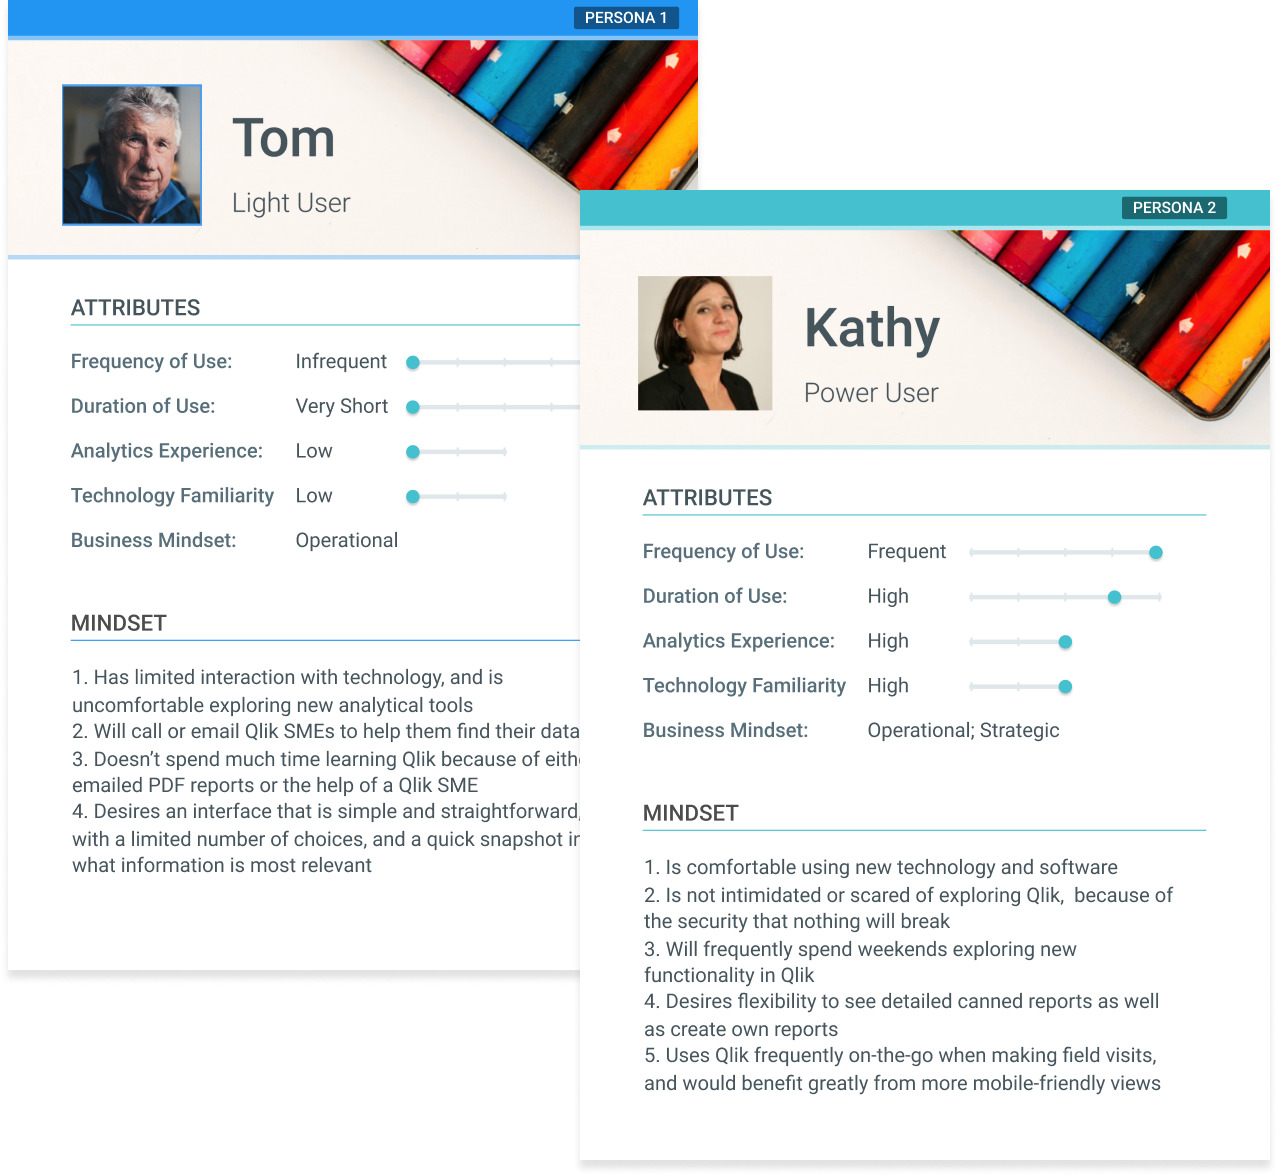
Defining Personas & Mindsets
I defined personas to answer the questions of how we could make the available information more complete and relevant, and I defined mindsets to understand how we could make the user experience more efficient, less overwhelming, and more designed for context.
three
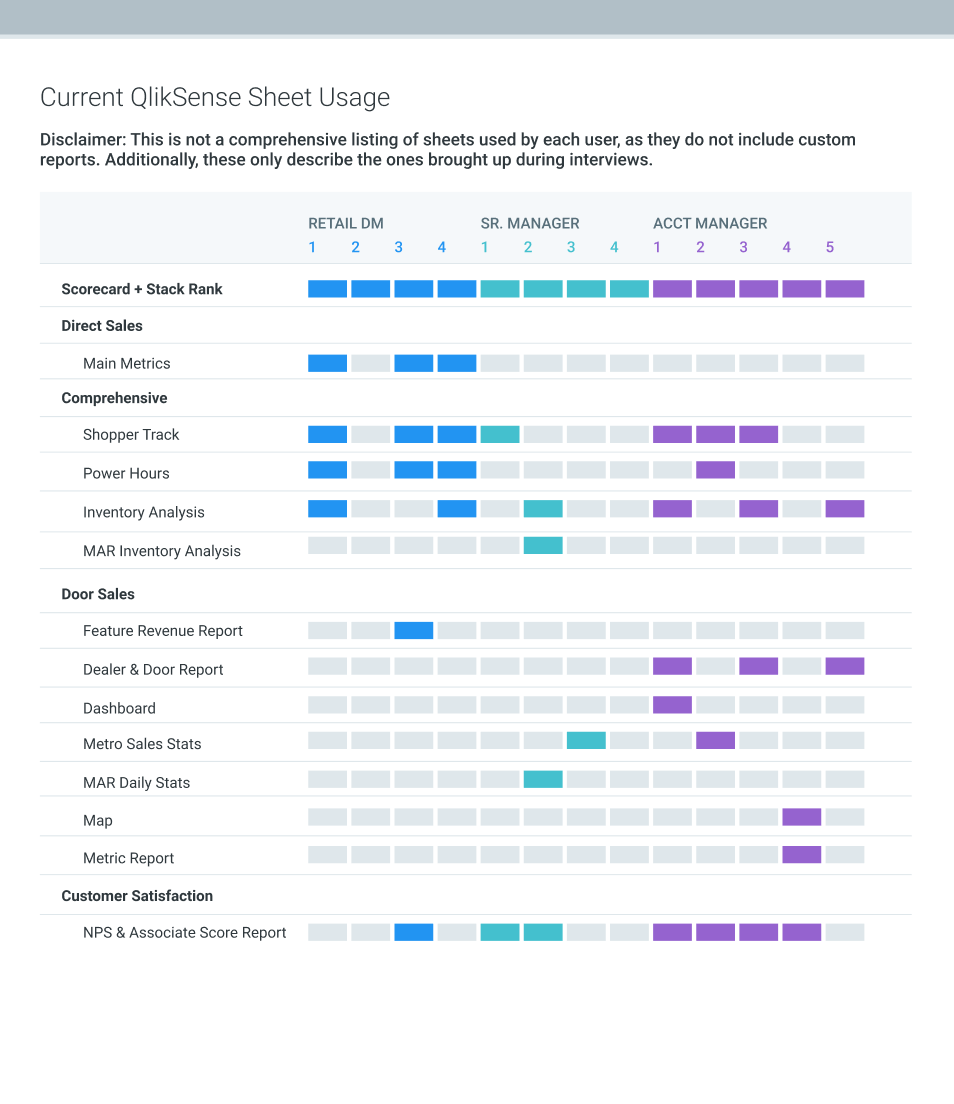
Auditing Current Applications
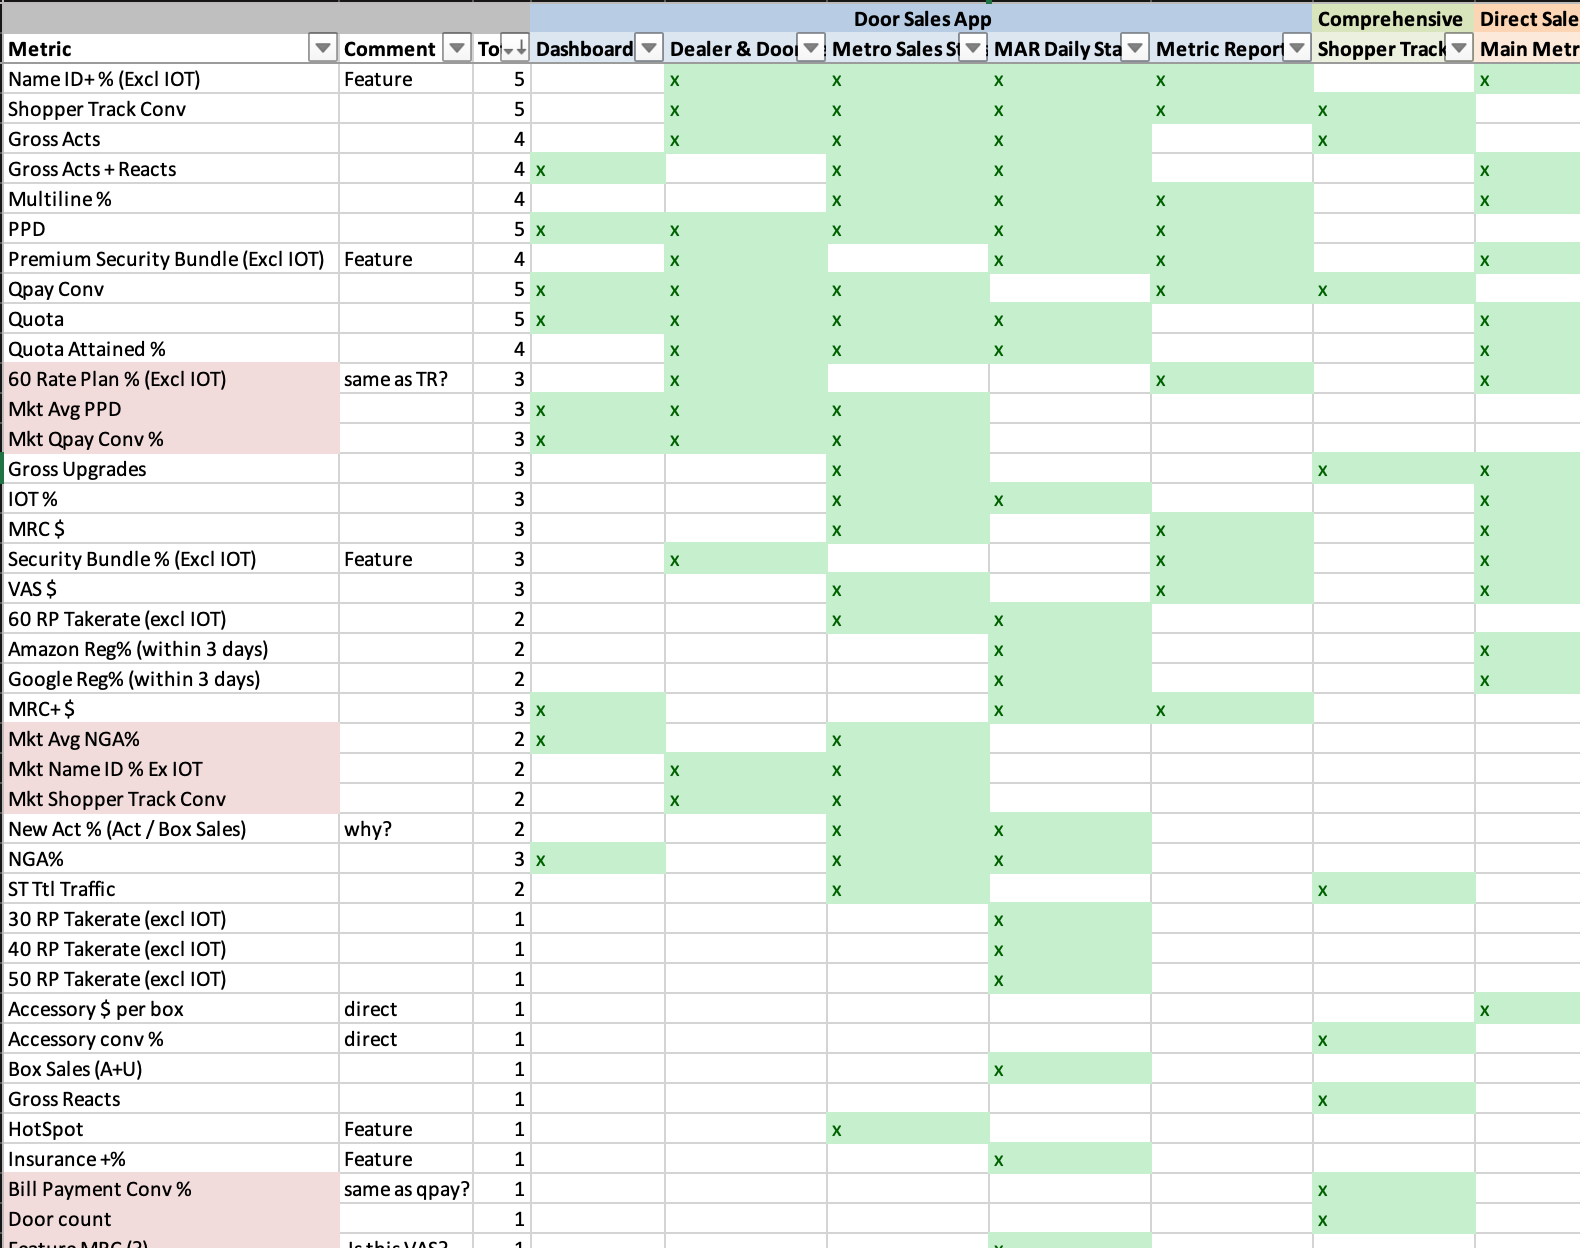
I conducted an audit to understand what were the most frequently used sheets, and whaat were the common metrics found on the most frequently used sheets.
Back to the Problem Statement...
Creating Solutions
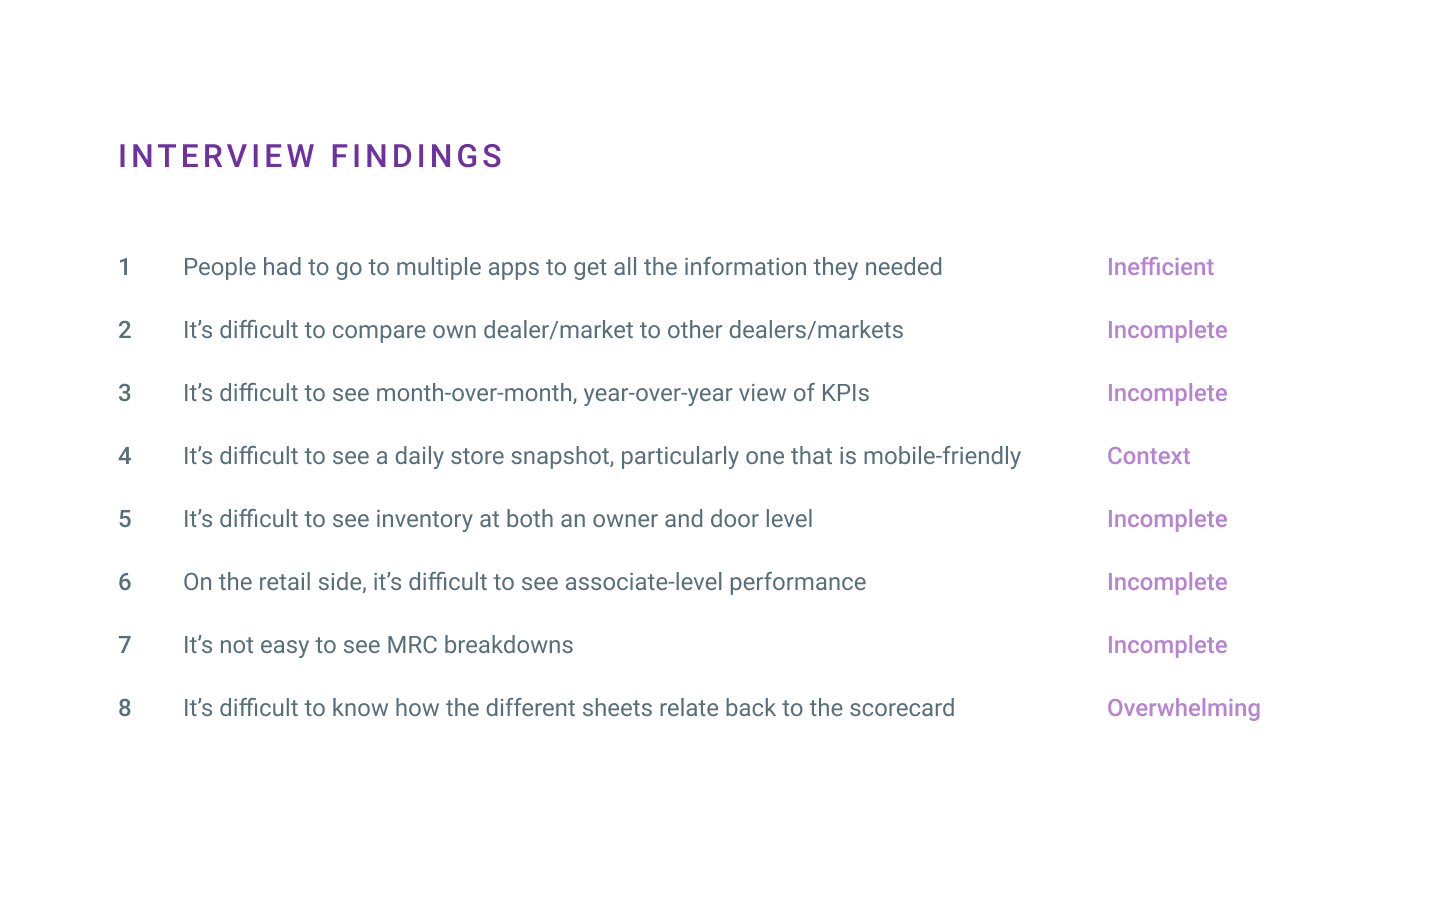
RESEARCH FINDING #1
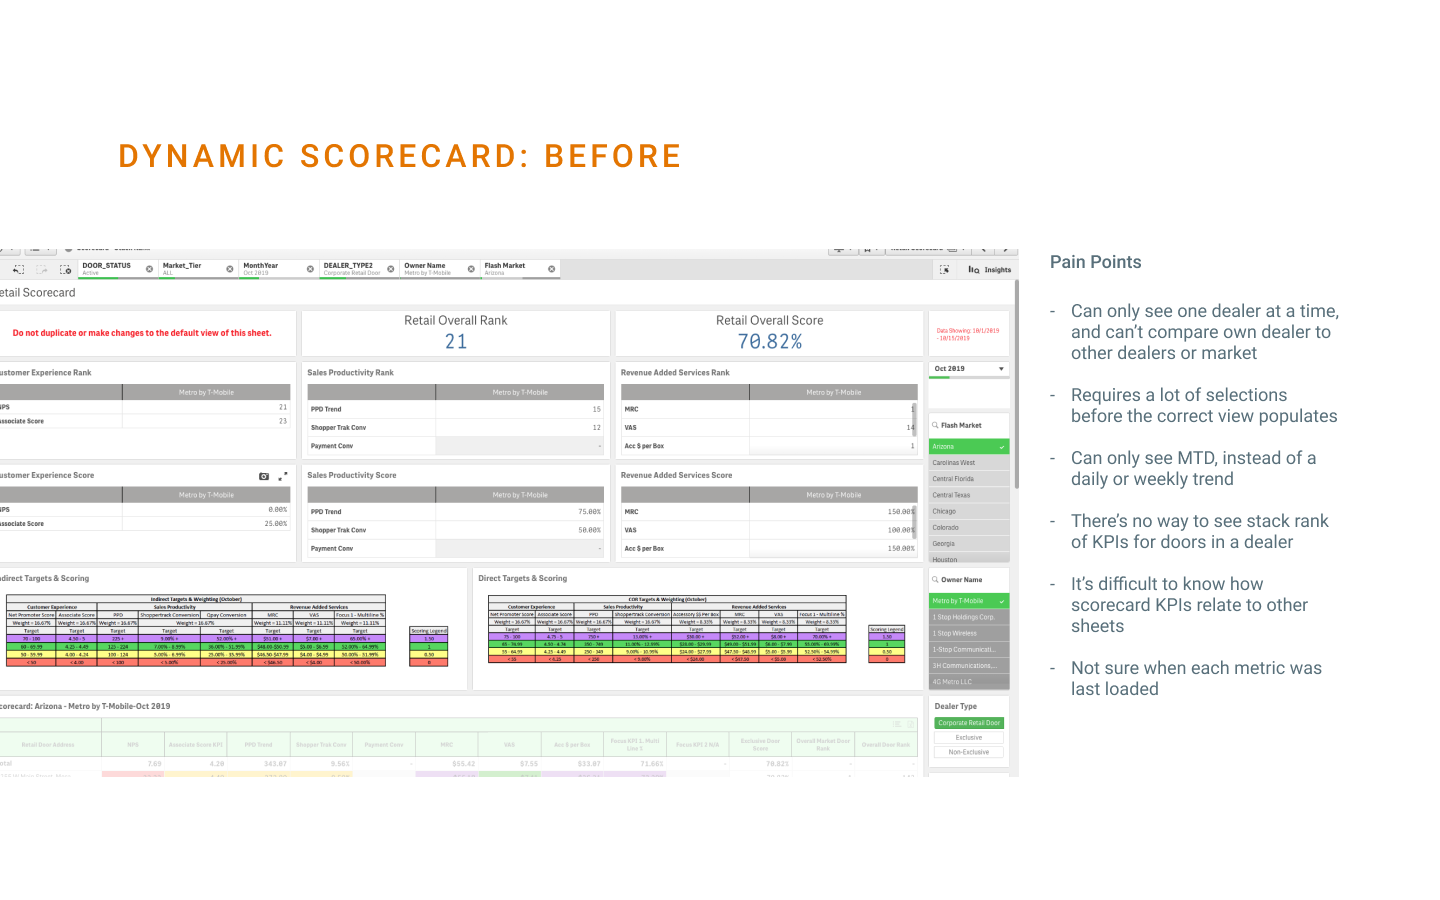
People had to visit 3-5 different applications in one session to get all the information they needed, and everyone had different metrics they needed to see
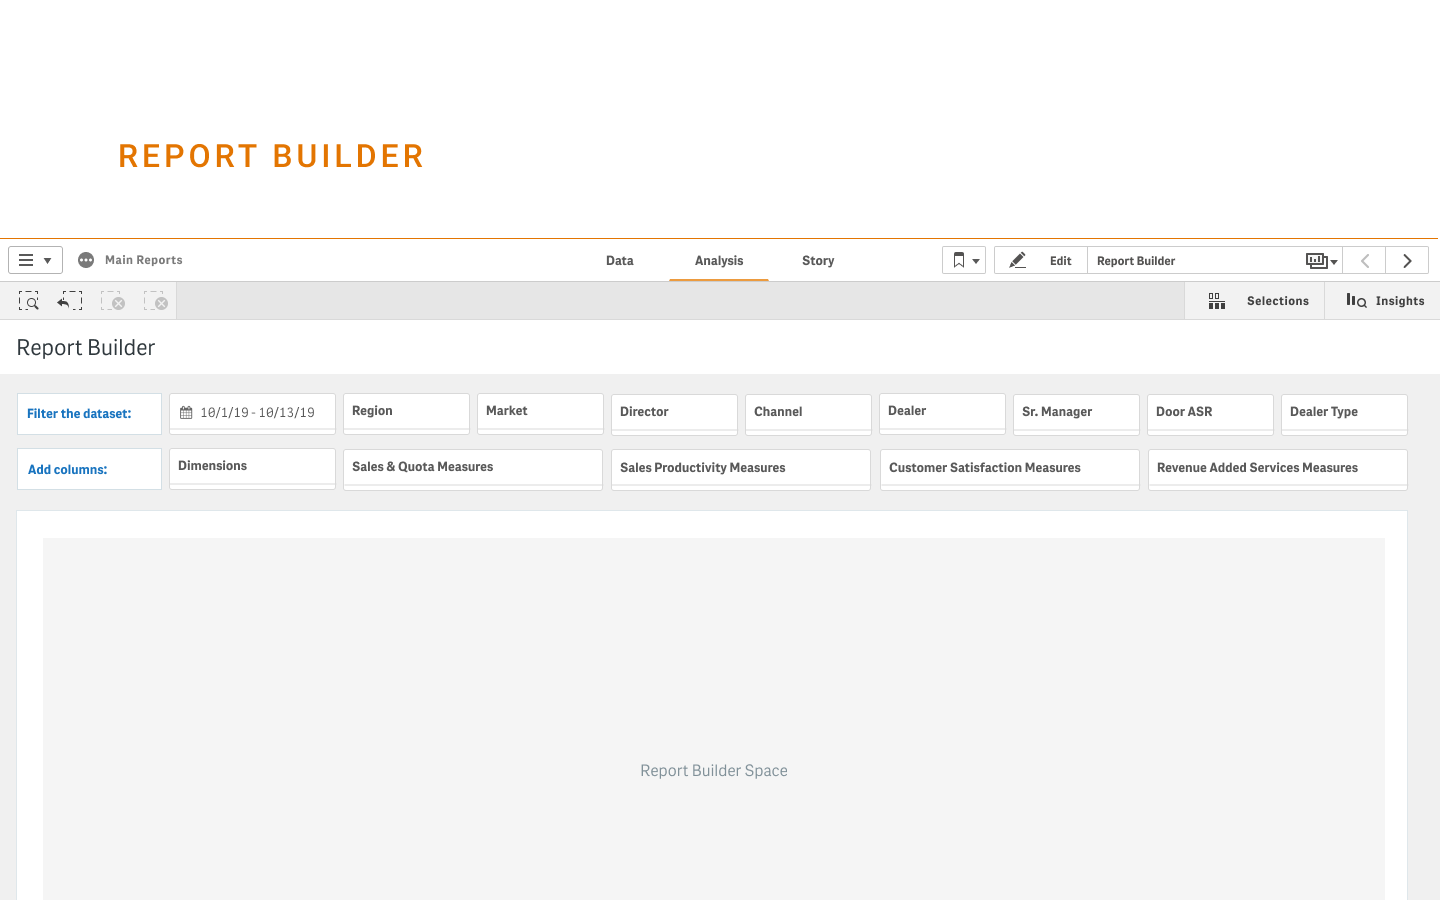
SOLUTION #1
A single application that consolidates all the main use cases
& A report builder to allow people to create custom reports
RESEARCH FINDING #2
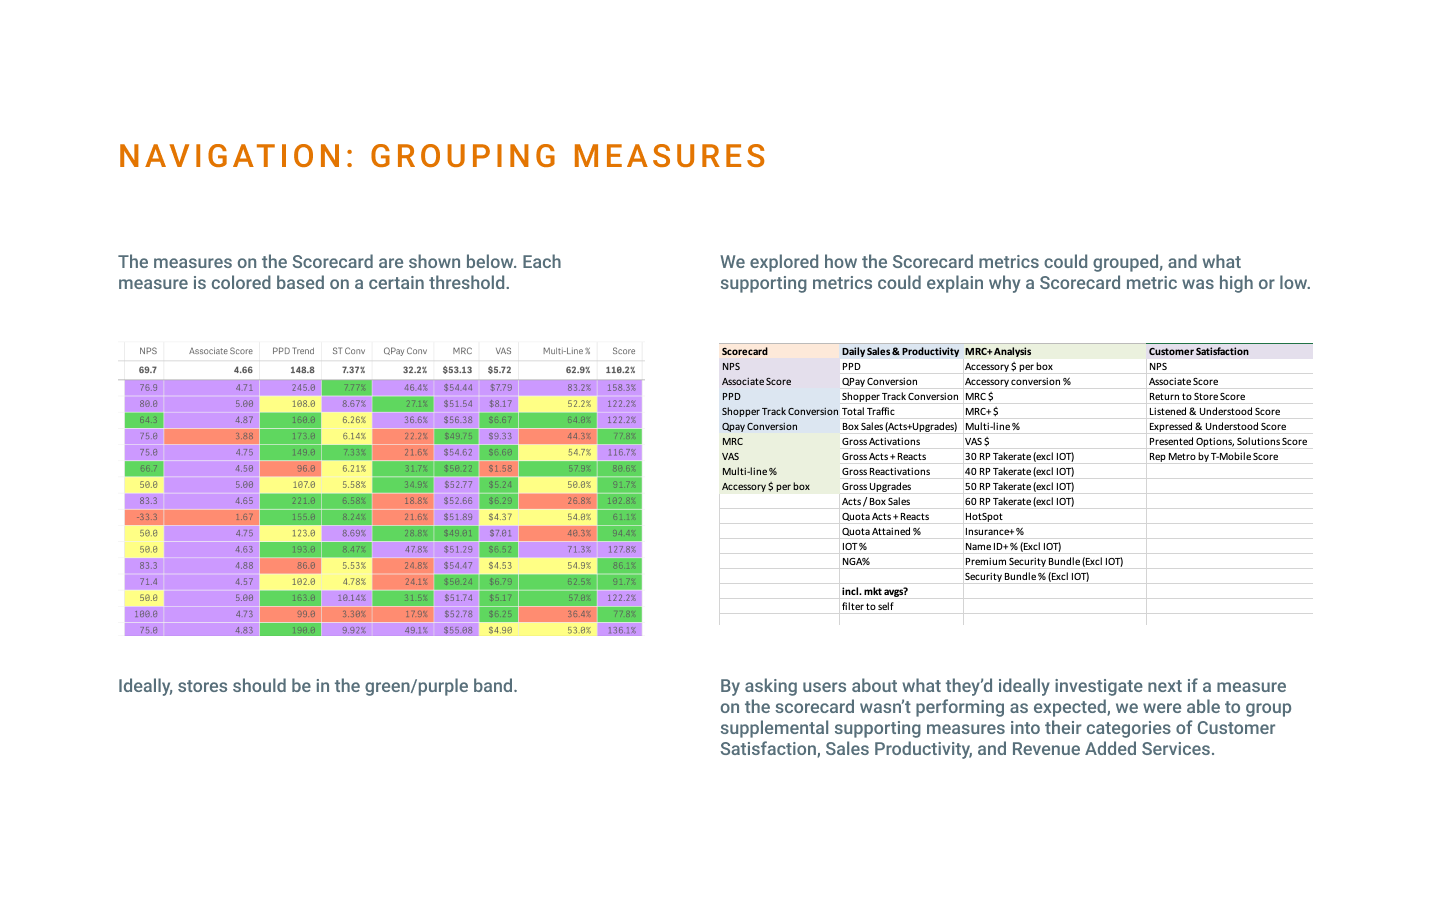
People didn’t know how all the reports related to the 9-10 key metrics on the Scorecard (the report used to evaluate their overall performance)
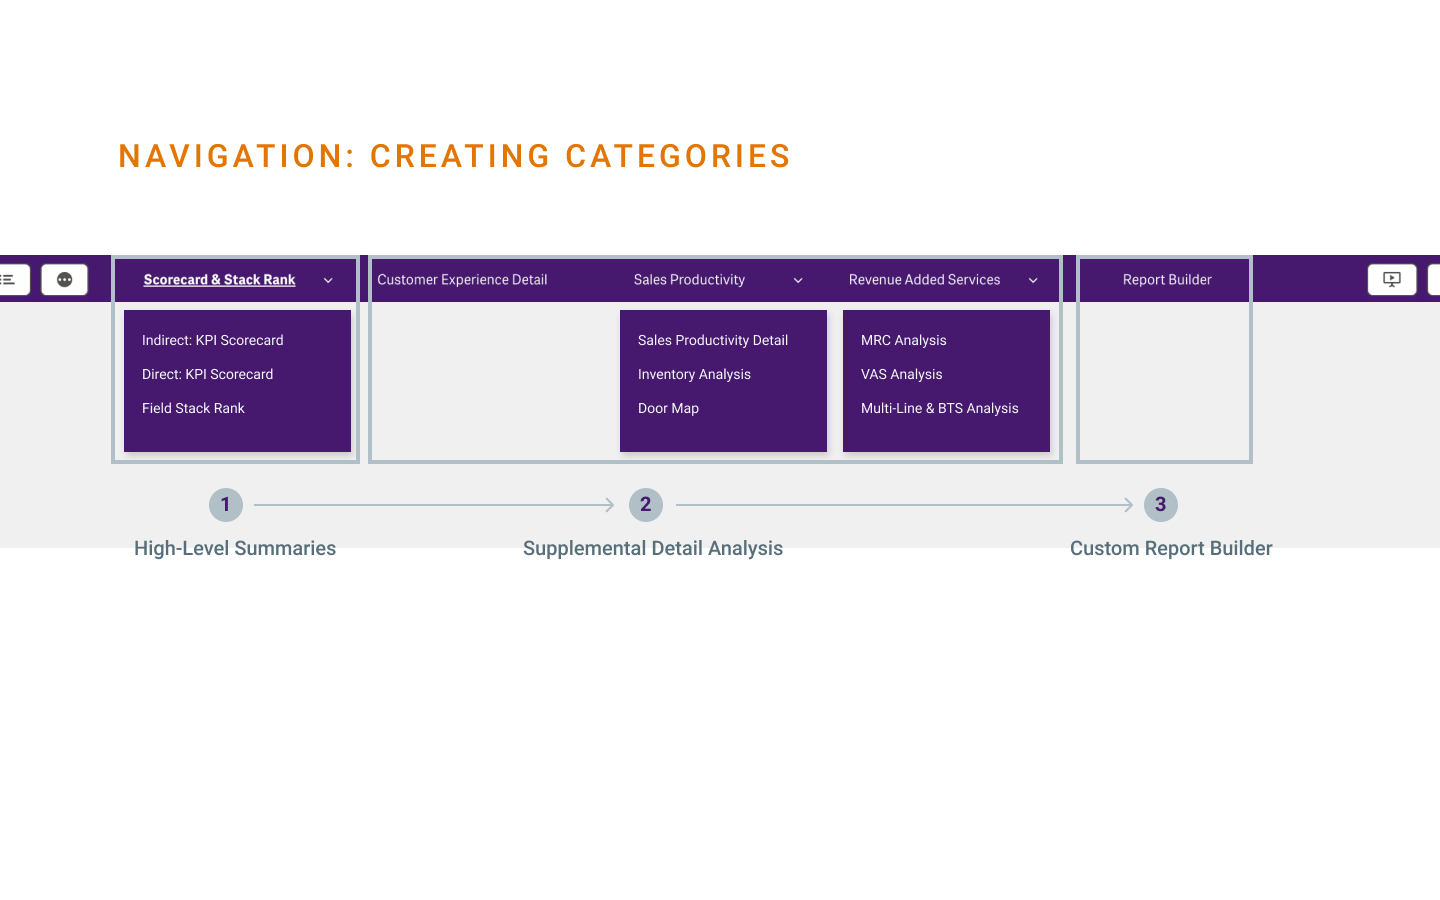
SOLUTION #2
Clear navigation categories that tie back to the Scorecard, with supplemental sheets that provide detail analysis into the 9-10 key metrics
RESEARCH FINDING #3
Important analyses about sales performance weren’t made available, making it difficult to make informed decisions
SOLUTION #3
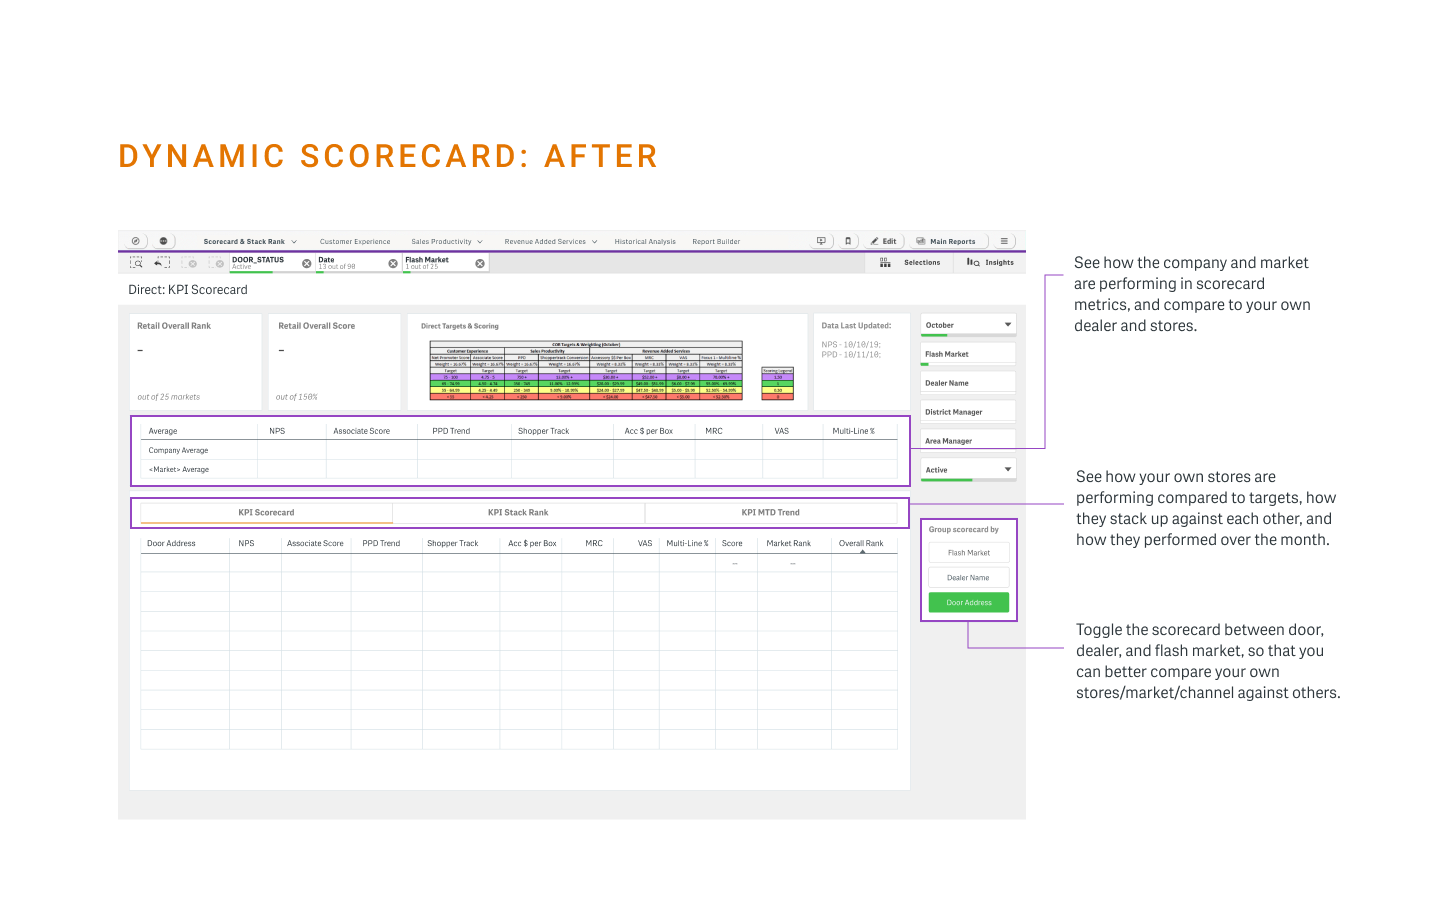
Revamped dynamic scorecard to enable peer comparison
& Newly designed sheets in the dashboard to provide missing analysis

RESEARCH FINDING #4
Reports weren’t mobile-friendly, which made it especially hard for the team to pull up when on-the-go and making field visits
SOLUTION #4
A single mobile-friendly sheet to provide a single store snapshot
& Future: A fully-functional app for mobile

Continued Iterations
After re-designing a new analytics experience, I conducted user feedback sessions, individual testing, and sent out a feedback form. This helped me to refine measures & filters for more actionability & relevance, increase clarity around language & functionality, and increase the overall delight of the experience.
A few lessons learned:
1. Starting with open-ended research questions can create better products
2. Surveys & group/solo interviews could have been more strategically used
3. Performance matters. Design needs to be flexible to efficiency demands
Want to know more?
Please contact me for a more thorough walkthrough of this case study.
Thank you for reading!