Manufacturing Learning Portal: Interactive Illustration
The Challenge
At a large manufacturing company, personnel on the shop floor didn’t have an easy way to learn what IT assets were available to them, how to use them and get value from them, and who to contact for more information. There was a need for an engaging and intuitive learning portal- something that could connect manufacturing operations at plants across the globe.
Process
The following use cases were developed at the beginning of the process, with some mid-project iterations made based on development feasibility:
- A plant manager wants to learn more about a specific tool, whether it be its purpose, prerequisites, benefits, impacts on KPI, price indications, key sites deployed, or the time it’d take for the tool to reach its potential.
- A plant manager has a few key words in mind (like supply chain or resources optimization) and wants to find out which tools meet these criteria.
- A plant manager wants to find and contact sites that have deployed specific tools, belong to a certain value stream, or are in a certain location.
- A plant manager wants to see what tools are commonly deployed in similar plants (i.e. same value stream).
- A product/tool owner needs to update the information associated with their tool (such as contact information, keywords, etc.) directly from the portal so that the changes are instantly available to any other users.
Solution
Part One:
To address the first two use cases, I designed an interactive illustration of a factory floor to ground IT tools to specific functions and locations in a manufacturing plant, whether it be tools in the warehouse, the assembly line, the repair/machine shop, and so on.Visually associating tools with a manufacturing function or a location on the shop floor allows for easy categorization and engaging navigation.

We also made the illustration searchable, enabling users to use keywords for immediately finding tools of interest.
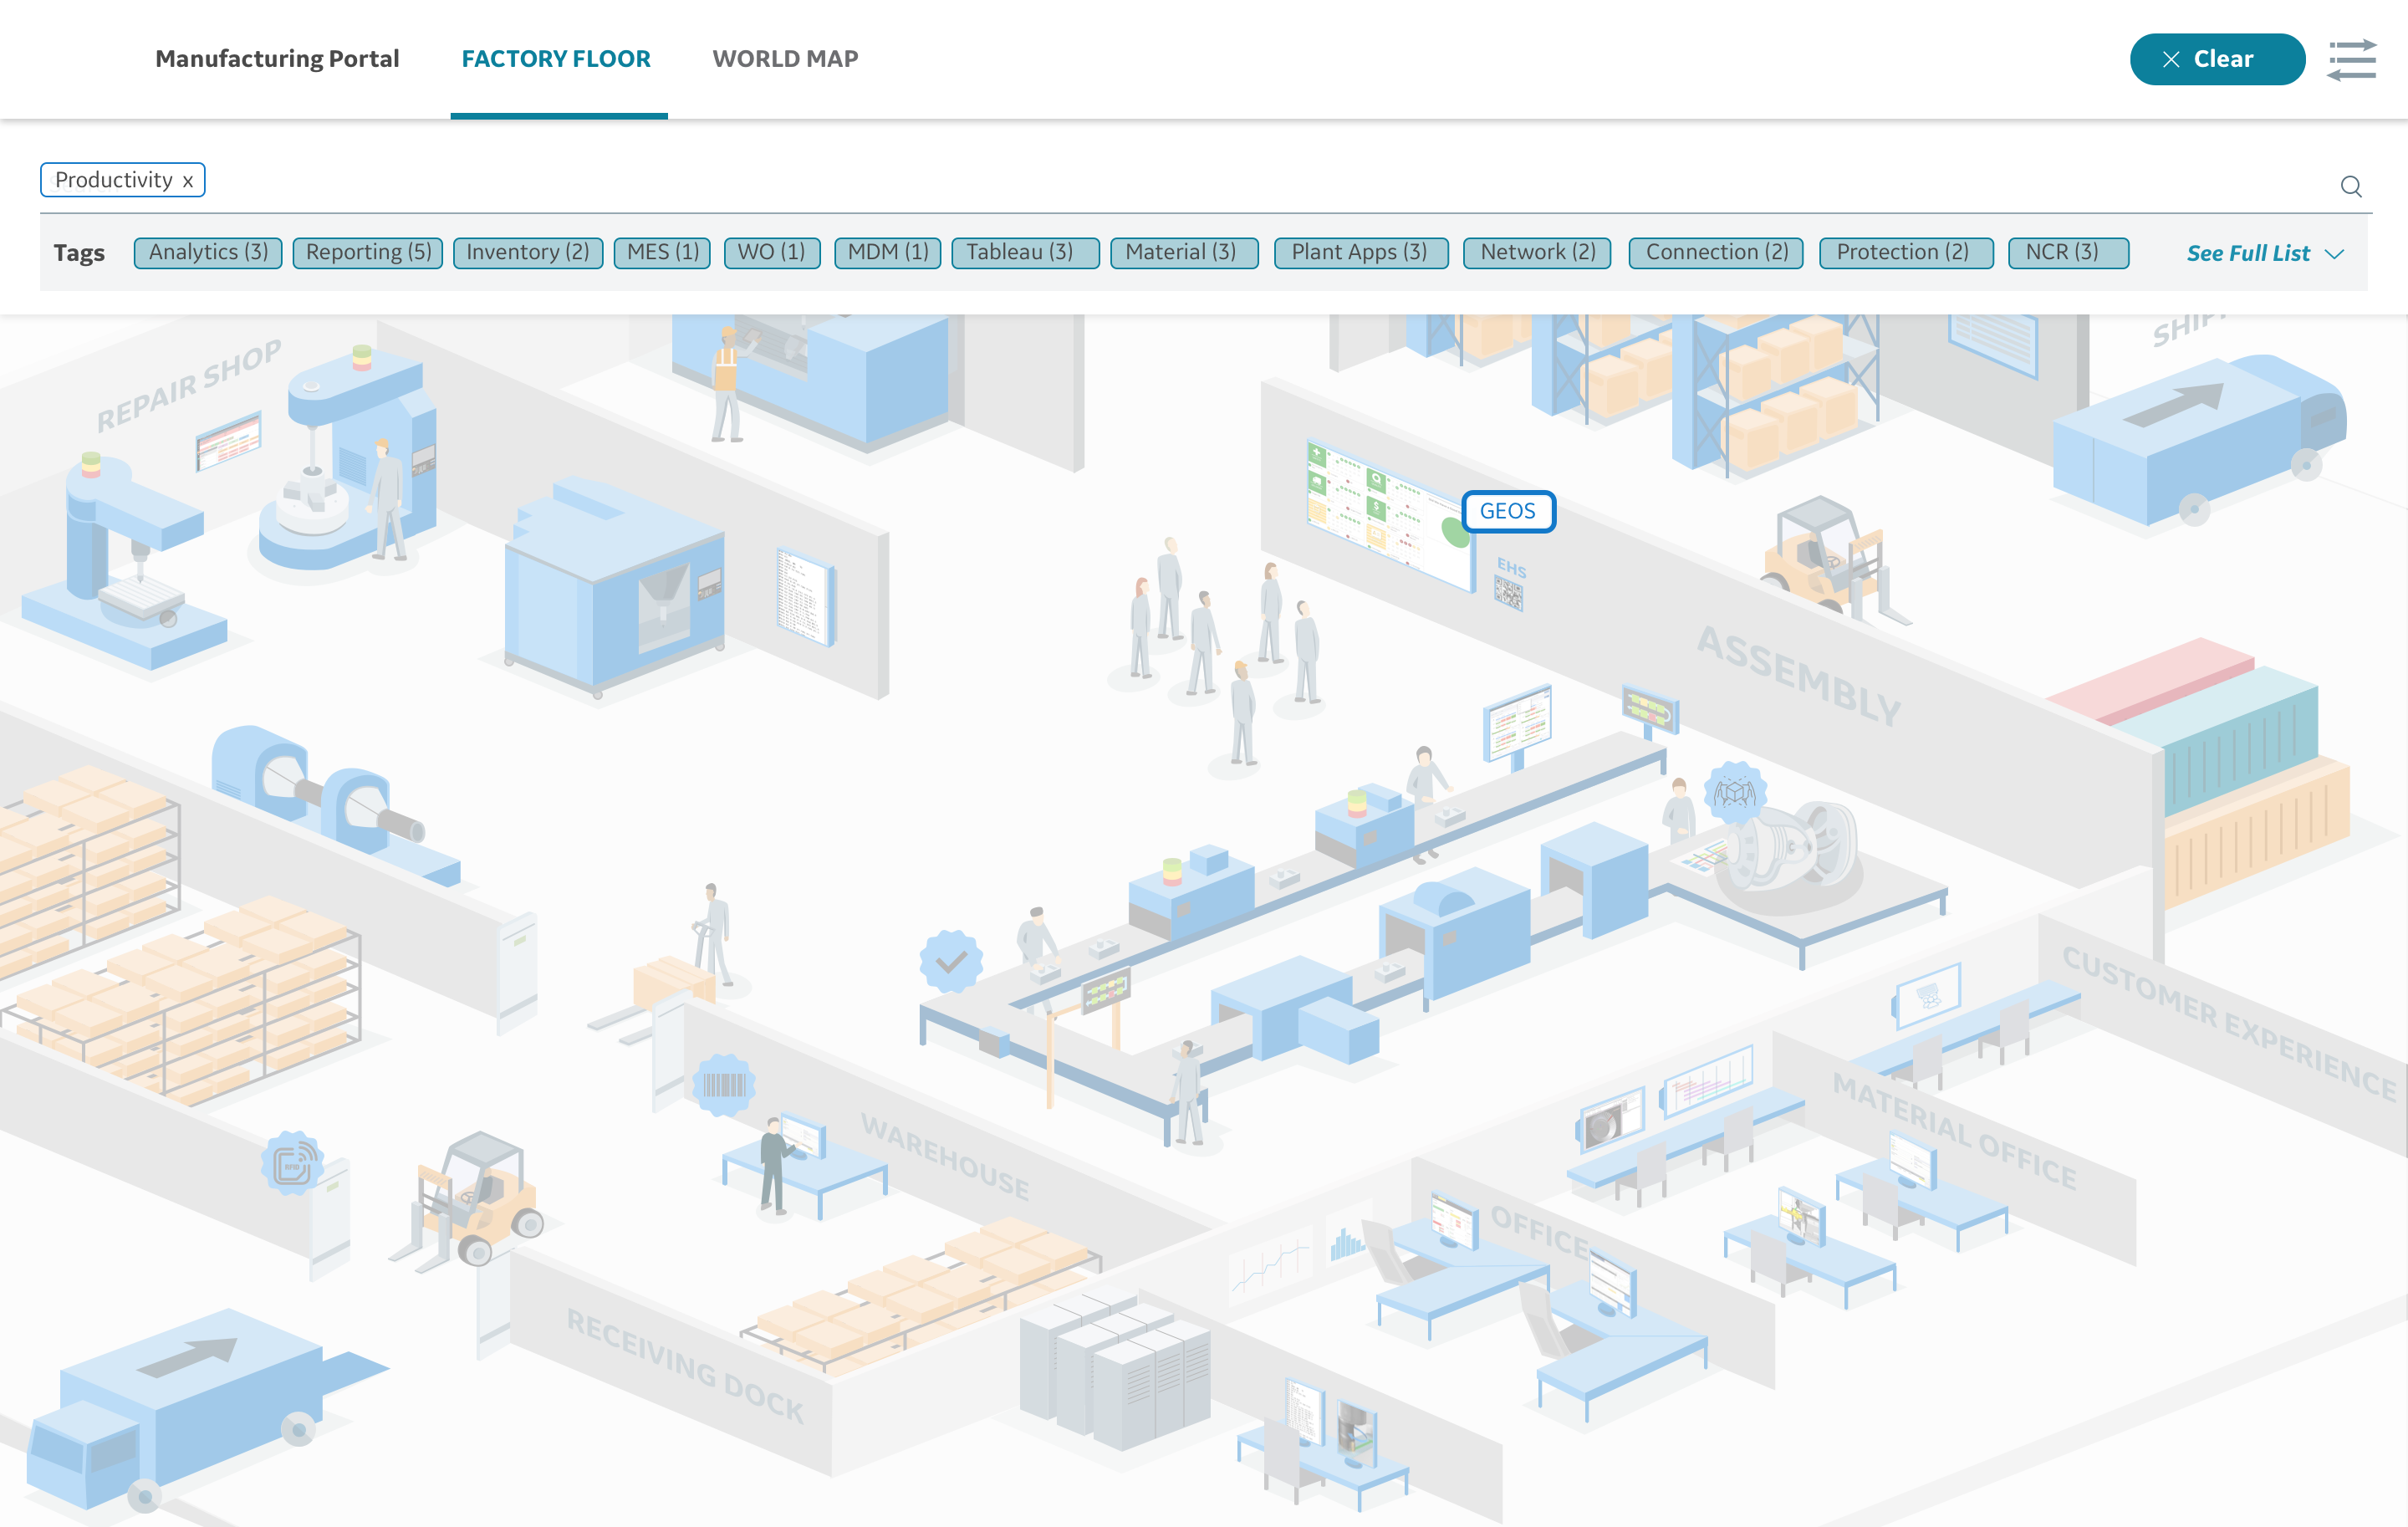
The details on the product card includes points of contact, prerequisites, soft benefits, key sites deployed, time to get to the full potential, and a glimpse into how the tool impacts KPIs (like cost, delivery, inventory, etc.) and the tool’s relationship between project complexity and pricing indication. We also included content from their knowledge sharing portal, so that documentation could be dynamically updated and maintained.

Any information on the card is editable by an administrator of that specific tool. If a user has access, he or she can click on the edit button in the top right and change the values for any of the fields.
Part Two:
To address the last two use cases, we designed an interactive map to provide visibility into where all manufacturing plants are located, what tools they’ve deployed, and who to contact for more information.
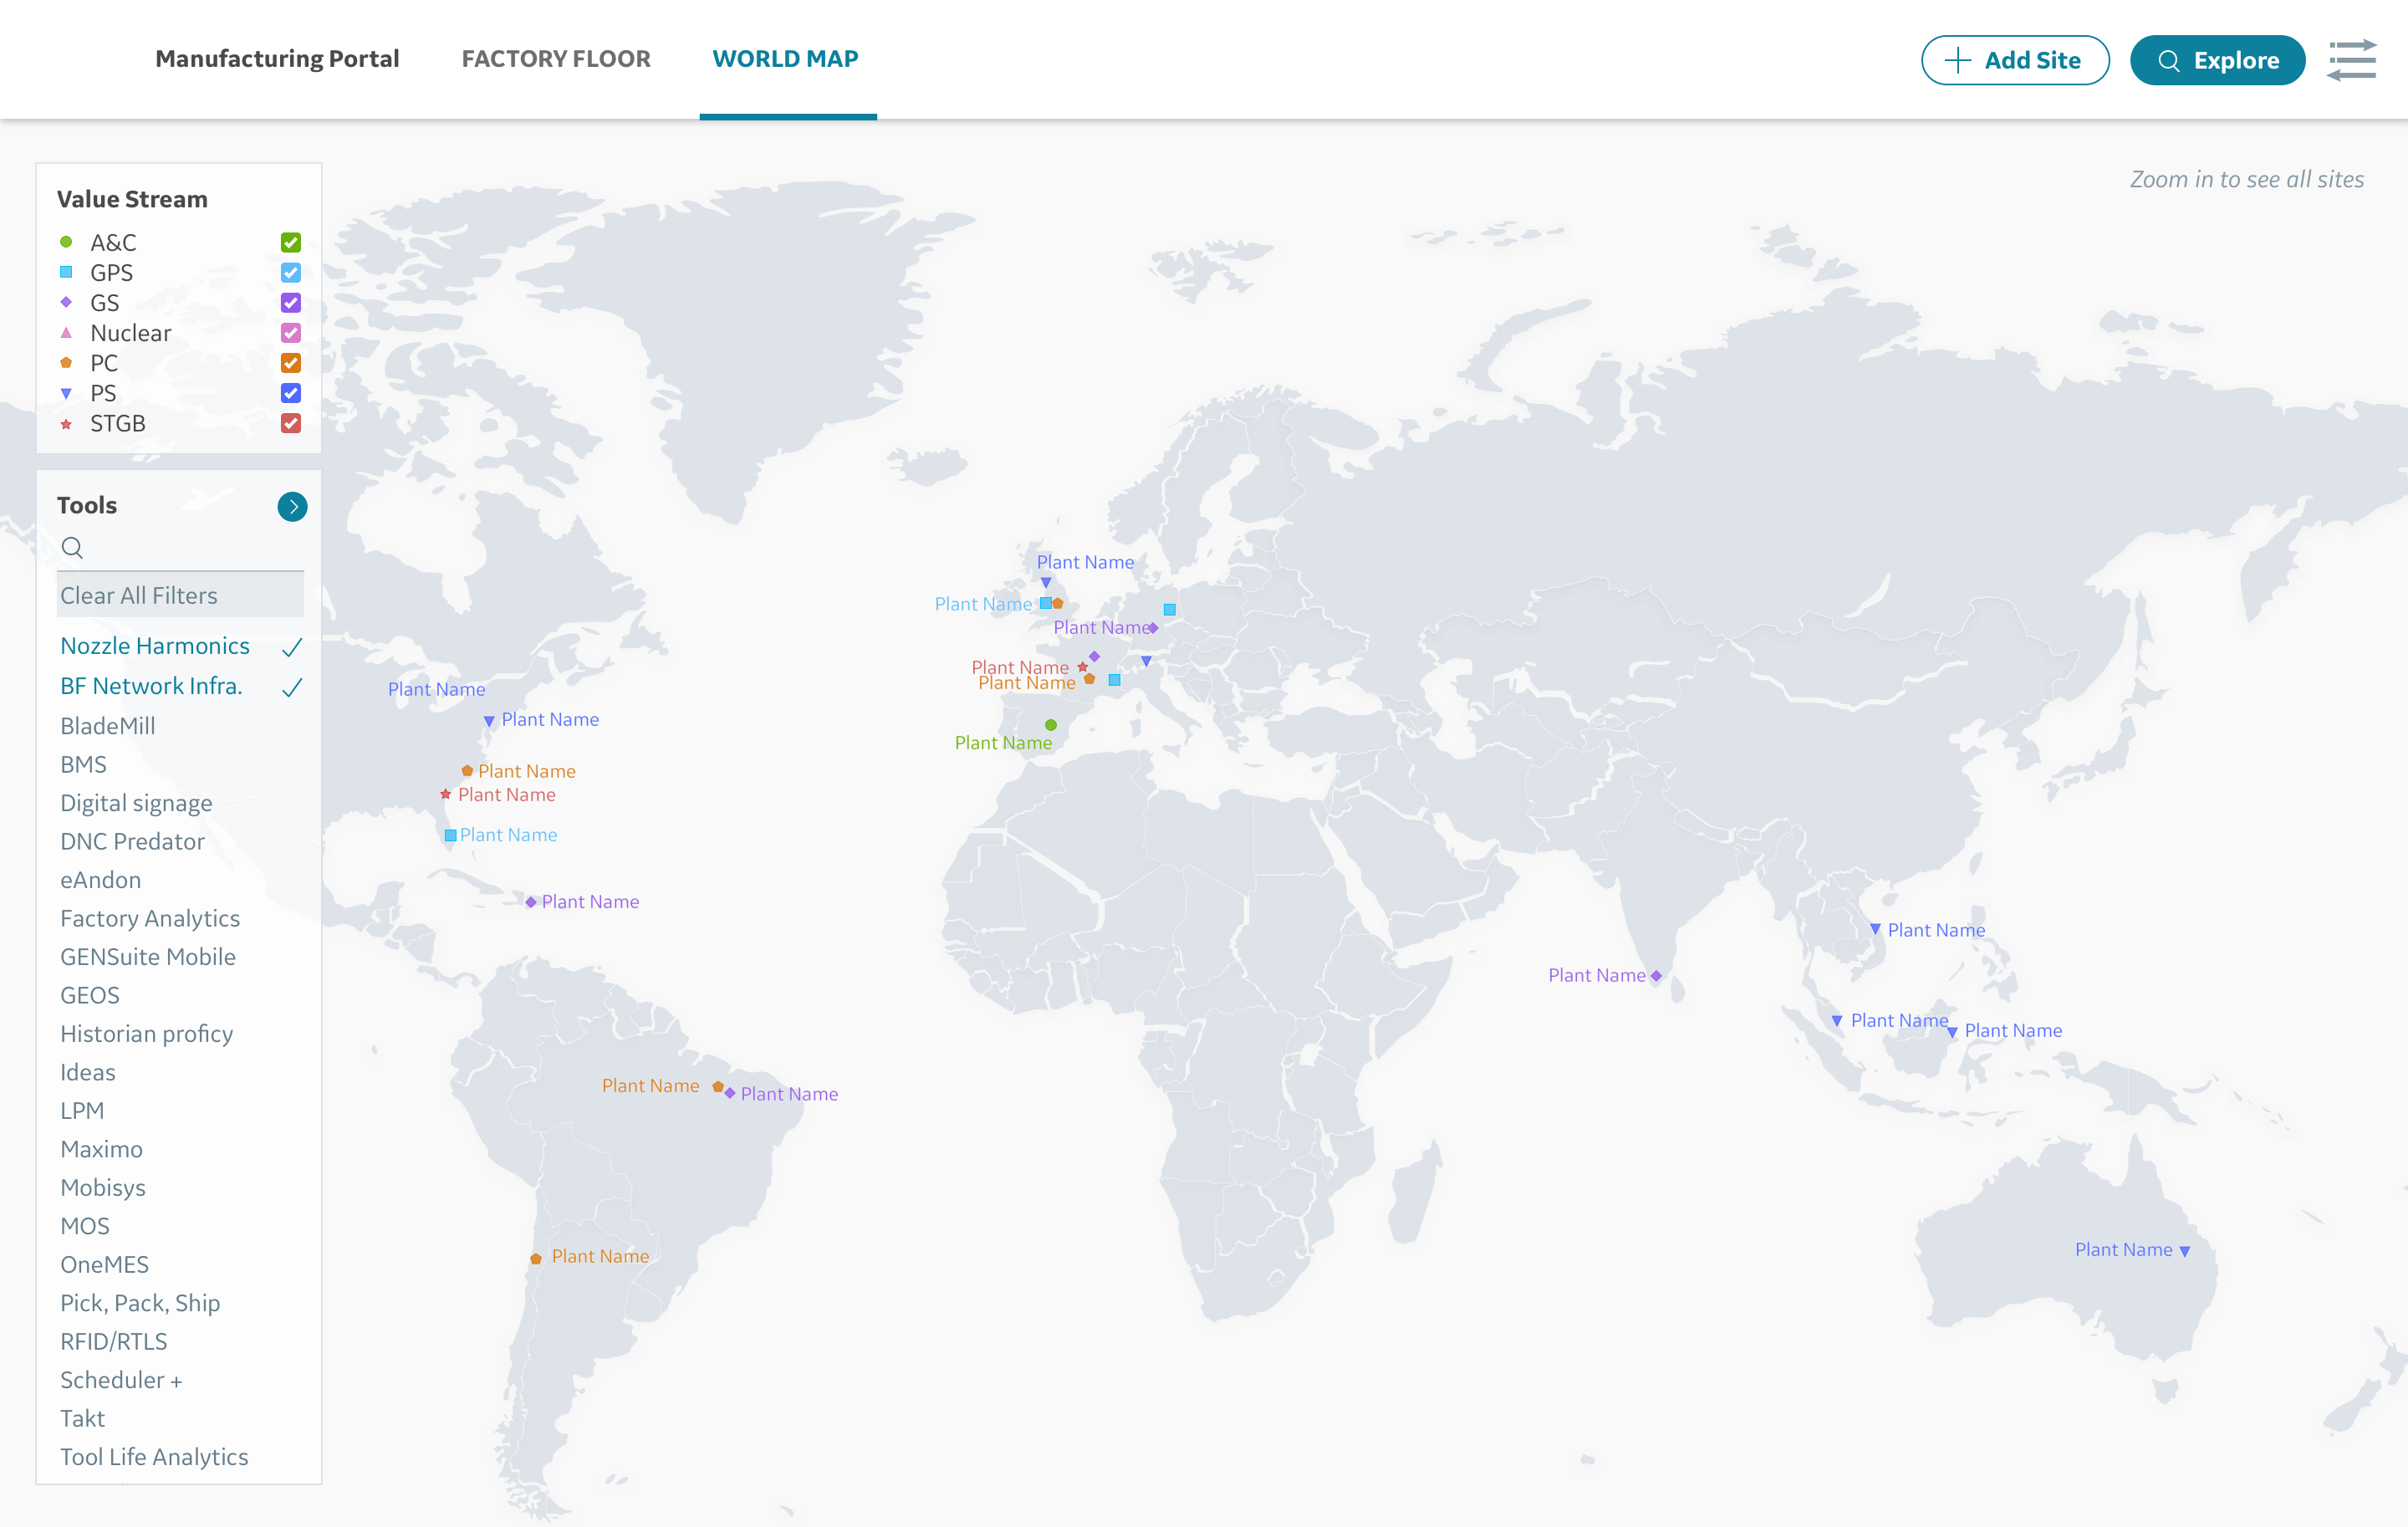
When expanding on the Tools list, users can see details into which tools are deployed at each plant, and what value stream each plant belongs to. This can help users immediately identify similar plants, and the ones who’ve deployed tools of interest. The Search functionality is also available for more direct identification of sites and locations.
JESSIE LIAN
Let's make meaning together.