Visual Analysis of Conflict in the DRC
The Challenge
Axis Group's submission to the 2017 Qlik Qonnections Hackathon.
The Democratic Republic of Congo is slowly recovering from a conflict known as Africa's first world war, which led to the loss of some five million lives between 1994 and 2003. Many eastern areas are still plagued by violence as various rebel groups continue to operate there.
Our goal was to build a tool for conflict analysis UN for them to be able to understand the problem and potentially even prevent a crisis with early intervention.
Questions we try to answer with conflict analysis
Conflict analysis is the systematic study of the profile, causes, actors, and dynamics of conflict. It helps development, humanitarian and peace-building organizations gain a better understanding of the context in which they work and their role in that context. With this in mind, some of the questions we aimed to provide insight into were:
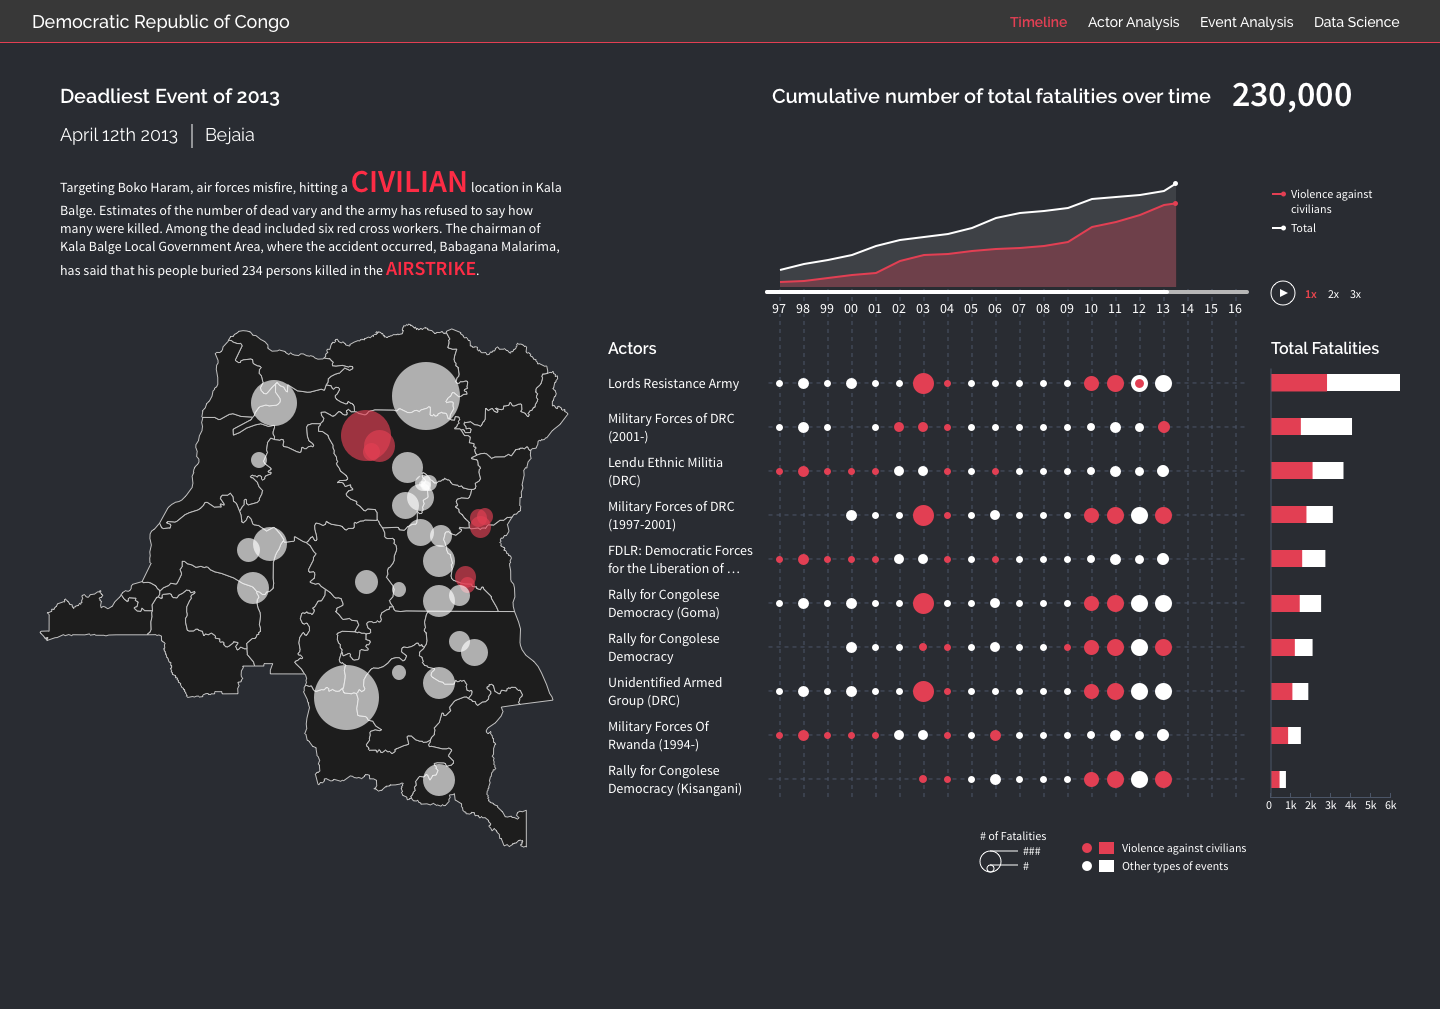
- How and when have civilians been affected by these incidents, in different parts of the country and over time?
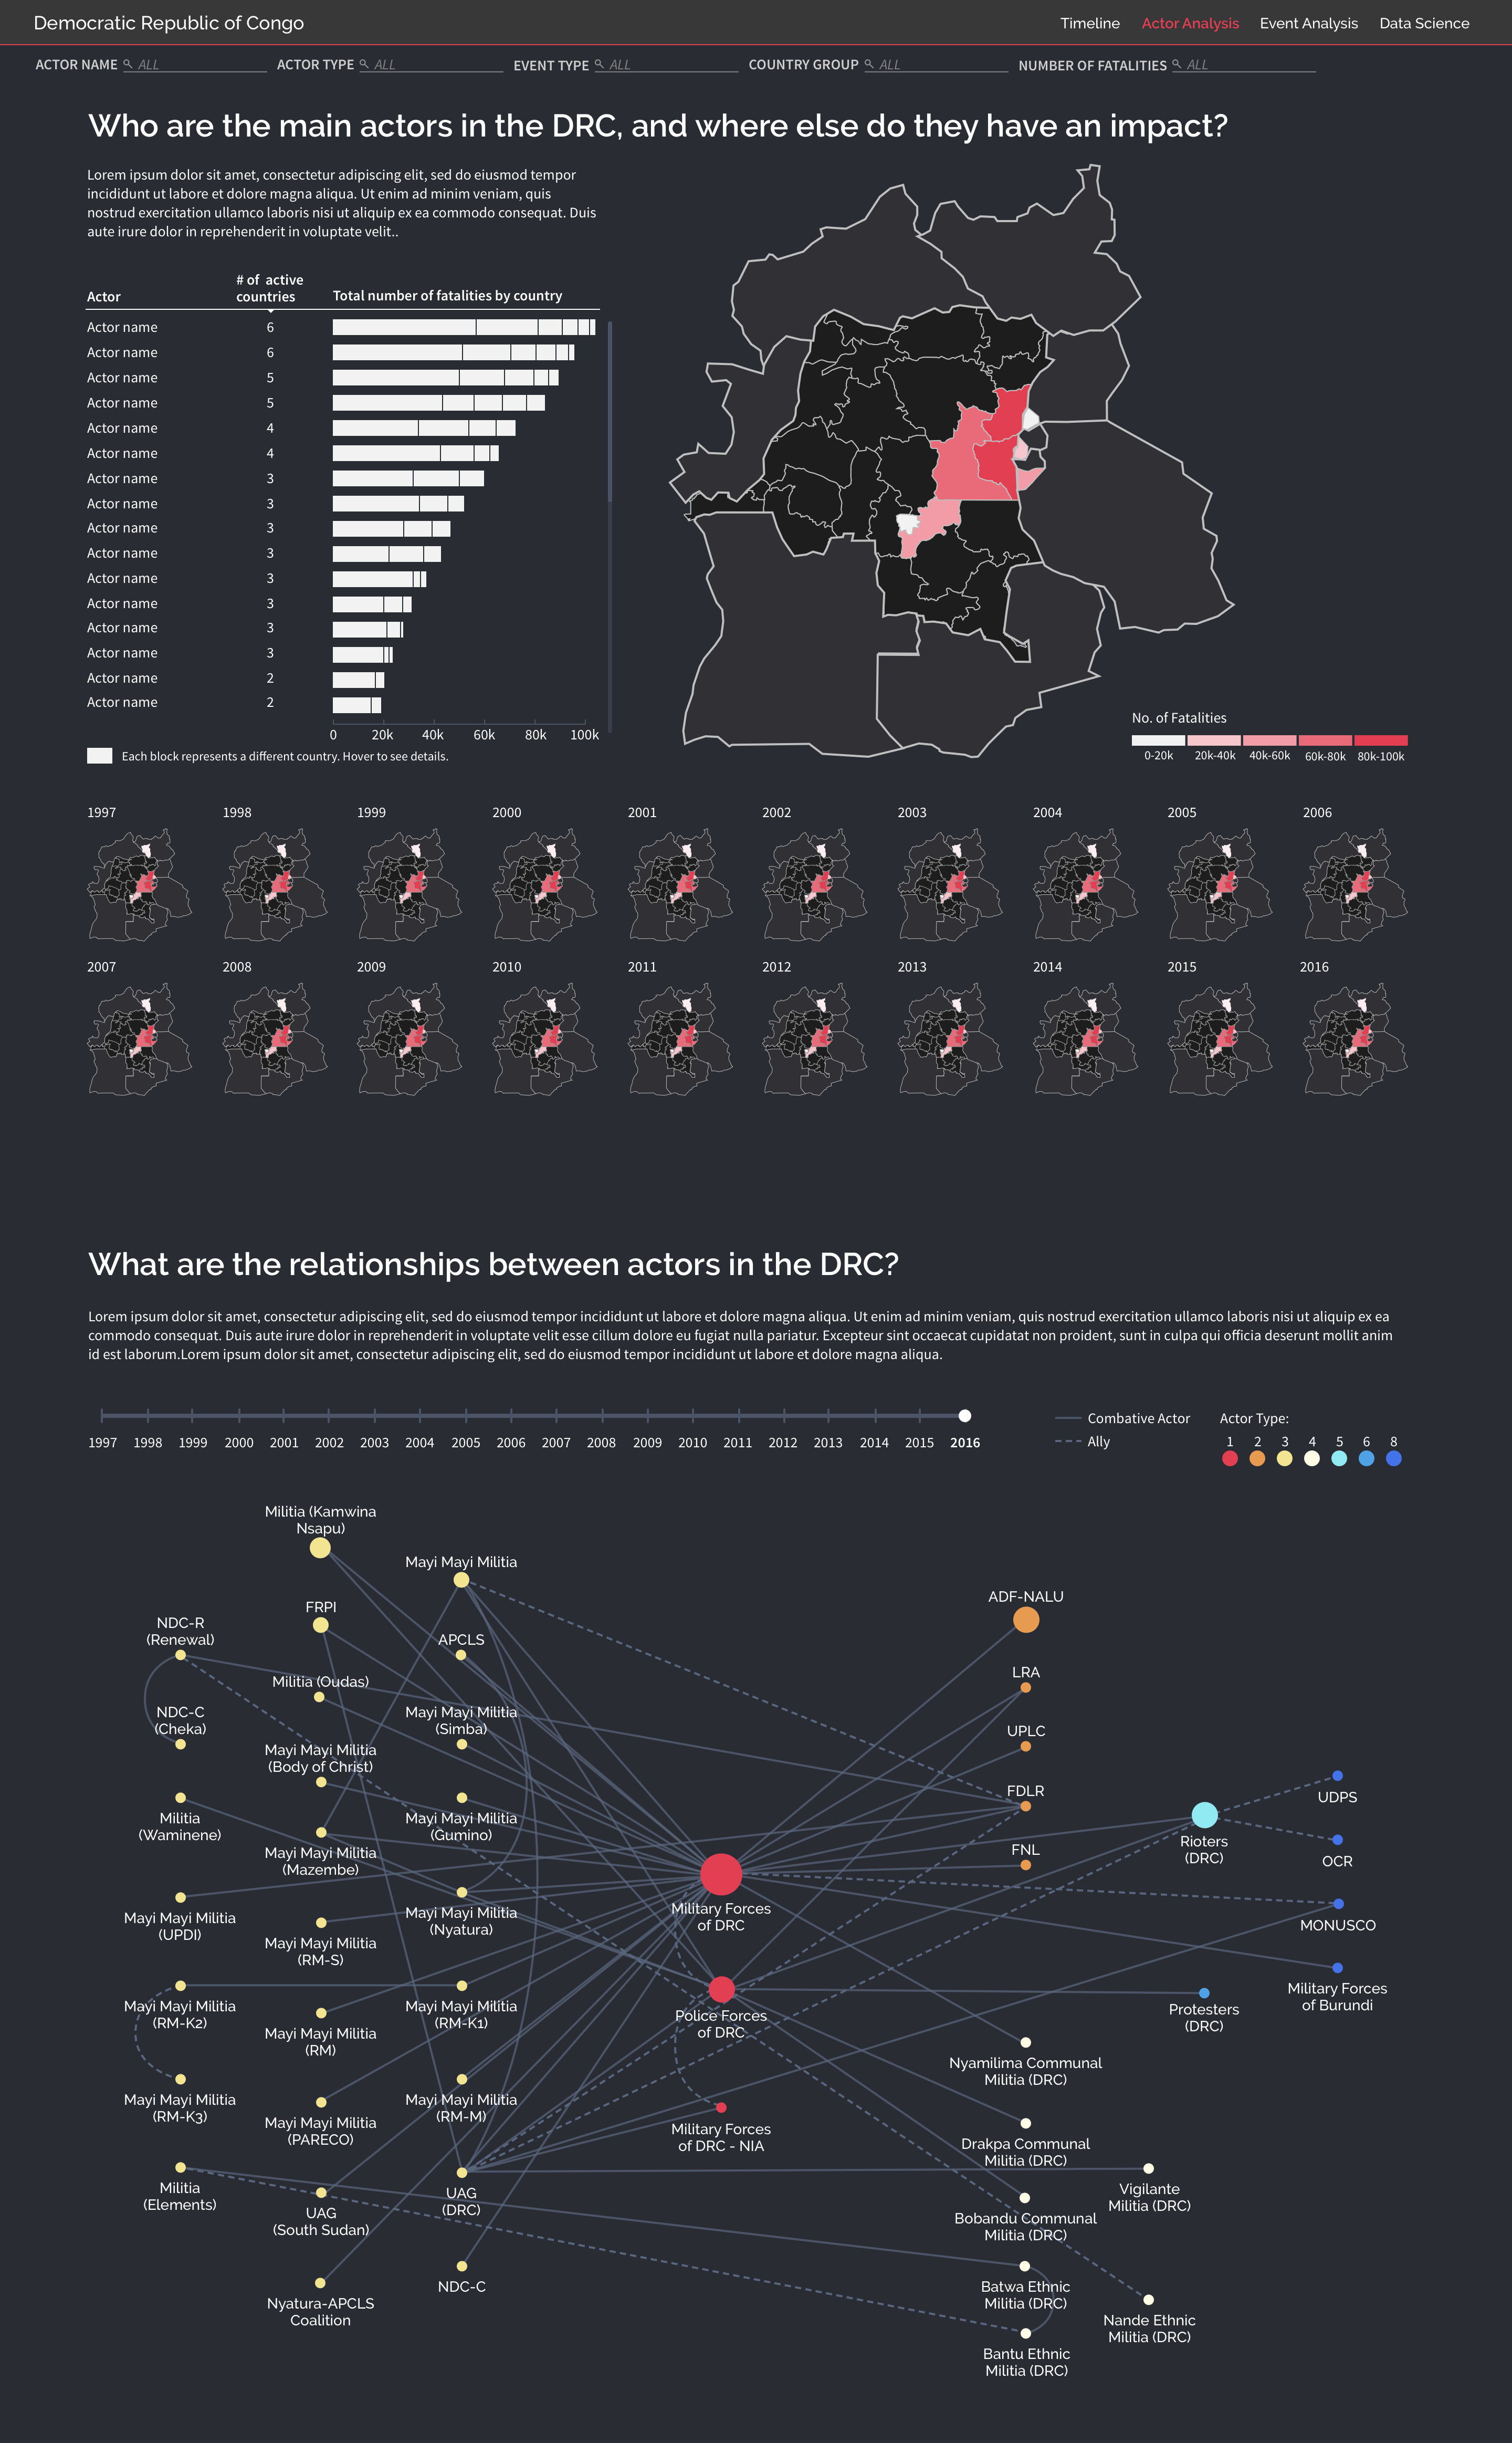
- Who are the main actors and what is their impact on the conflict?
- Can spikes in the frequency and intensity of incidents be correlated with any other parameters?
- Based on the features and actions of an actor/group, can we predict the likelihood of future behavior?
Solution Walkthrough
Timeline: The goal of the timeline was to shed light on the the intersection of when, how, where, and how many were reported dead. We decided to visualize the data through a sobering animation, hoping to respect the situation by asking the user to pause and observe the accumulating victim count. We also included descriptive text from the dataset to provide context to the numbers. If a user wanted to dig deeper into the data, there's also flexibility to pause the animation and drill into a year to see the group responsible for deaths based on the size and geographic locations.
Actors Analysis: Here, we aimed to identify who the main actors were, and where they had the highest impact. The combination of the bar chart and map provided interactive analysis for the user to correlate actor and geographic area, as well as to see how and when civilians were affected by these incidents. In the live version, we also intentionally changed the color scale of the map to be a logarithmic scale, so as to best distinguish the differences in areas.
We also created a network diagram to show the relationships between various actors, exploring the question of how alliances form or break over time. Moving through the time slider reveals that there isn't necessarily a good vs. bad actor, but that main actors of conflict are continuously changing hands over time.
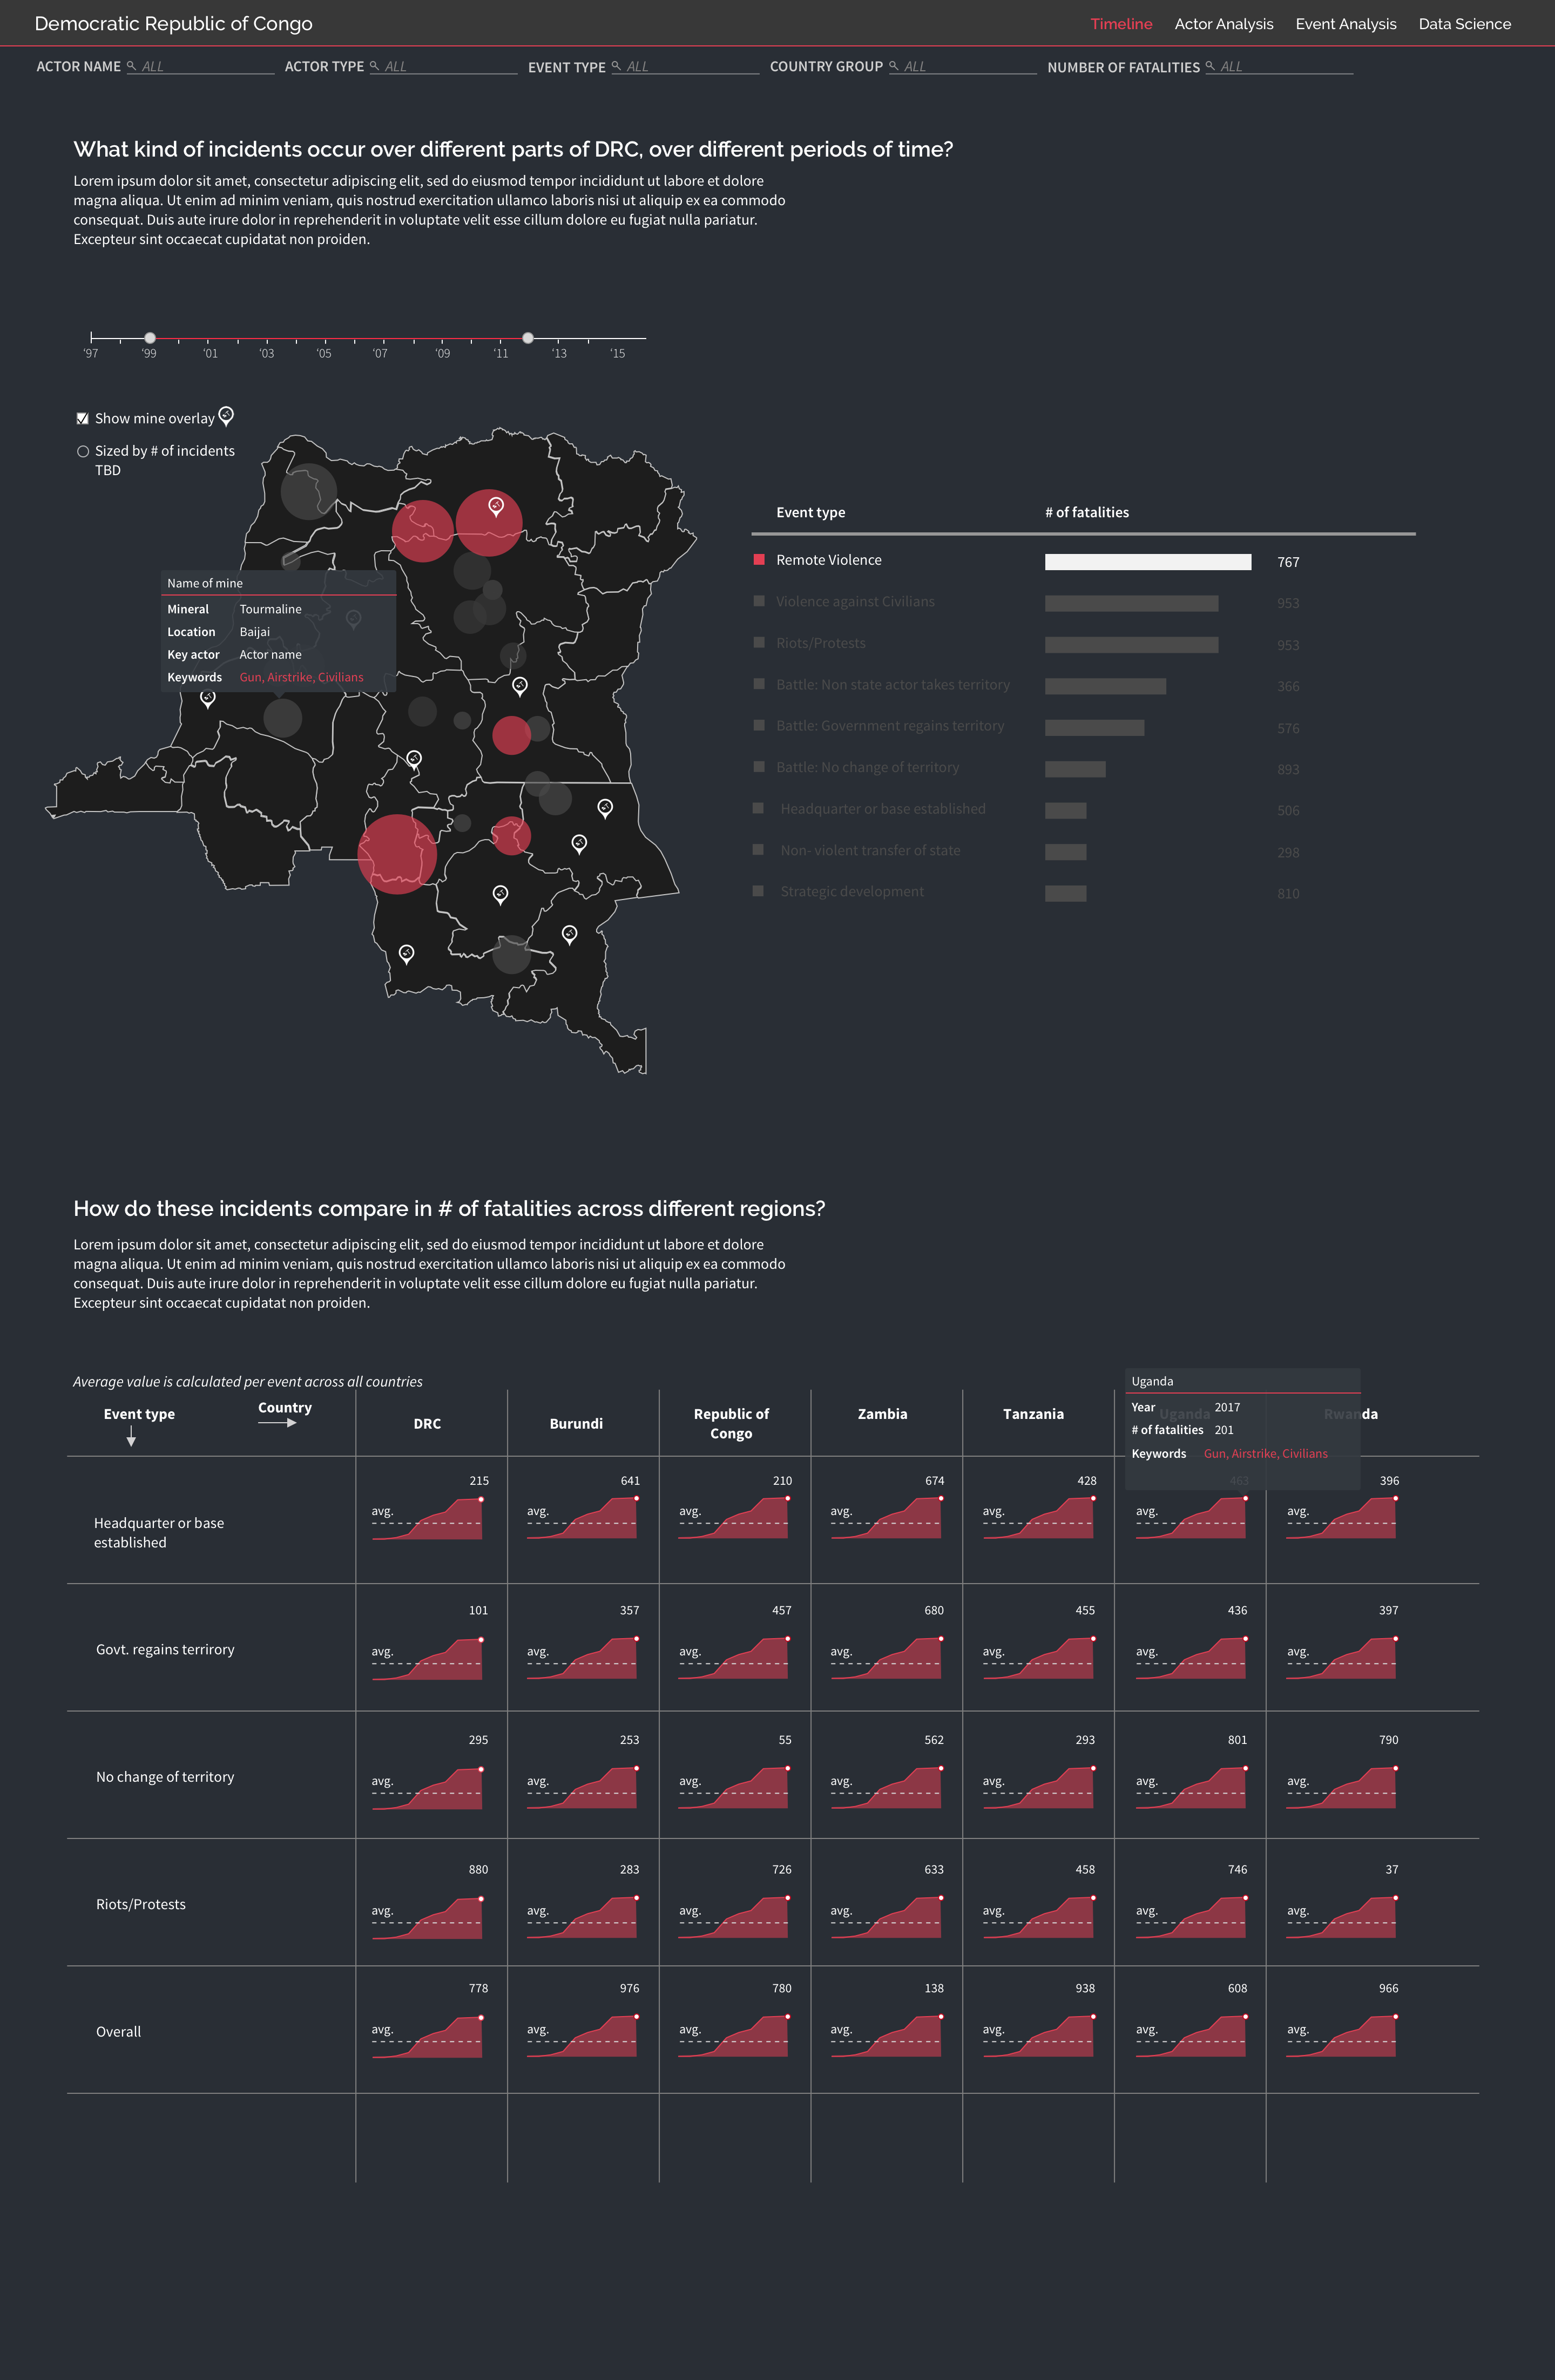
Events Analysis: The Events Analysis provides an overview of the types of conflict most common in different regions of the DRC over time.
JESSIE LIAN
Let's make meaning together.