Analytics Resource Library
The Challenge
I encountered 3 different clients who all faced the same issue: there's too much information available. There were too many dashboards and not enough guidance, consistency, or organization, making it difficult for users to find the metrics and reports most relevant to them.
Research
I interviewed 12 different people in one of the organizations, many with differing roles and responsibilities. My main goal was to understand how different users were currently navigating the analytics hub, and the kind of friction they were facing. We then organized and grouped the pain points on the whiteboard, drawing these key insights:
- Users aren’t sure how to use, navigate, filter, and bookmark within Qlik
- There’s an overwhelm of information, with a lot of noise caused by old or duplicate reports. Users need to quickly get to their detailed information, down to an object and sheet level. They need to easily answer: Which reports are relevant to my role? What path do I follow to get to them? Once I’m there, how do I use them?
- Naming conventions are Inconsistent and/or unfamiliar across applications/streams, where the same measure might be called different things in different streams
- Information relevant to role isn’t consolidated; users need to go across streams and applications to see their data
- Application and sheet names are not descriptive enough for users to know what information they’ll find once they click through
.png)
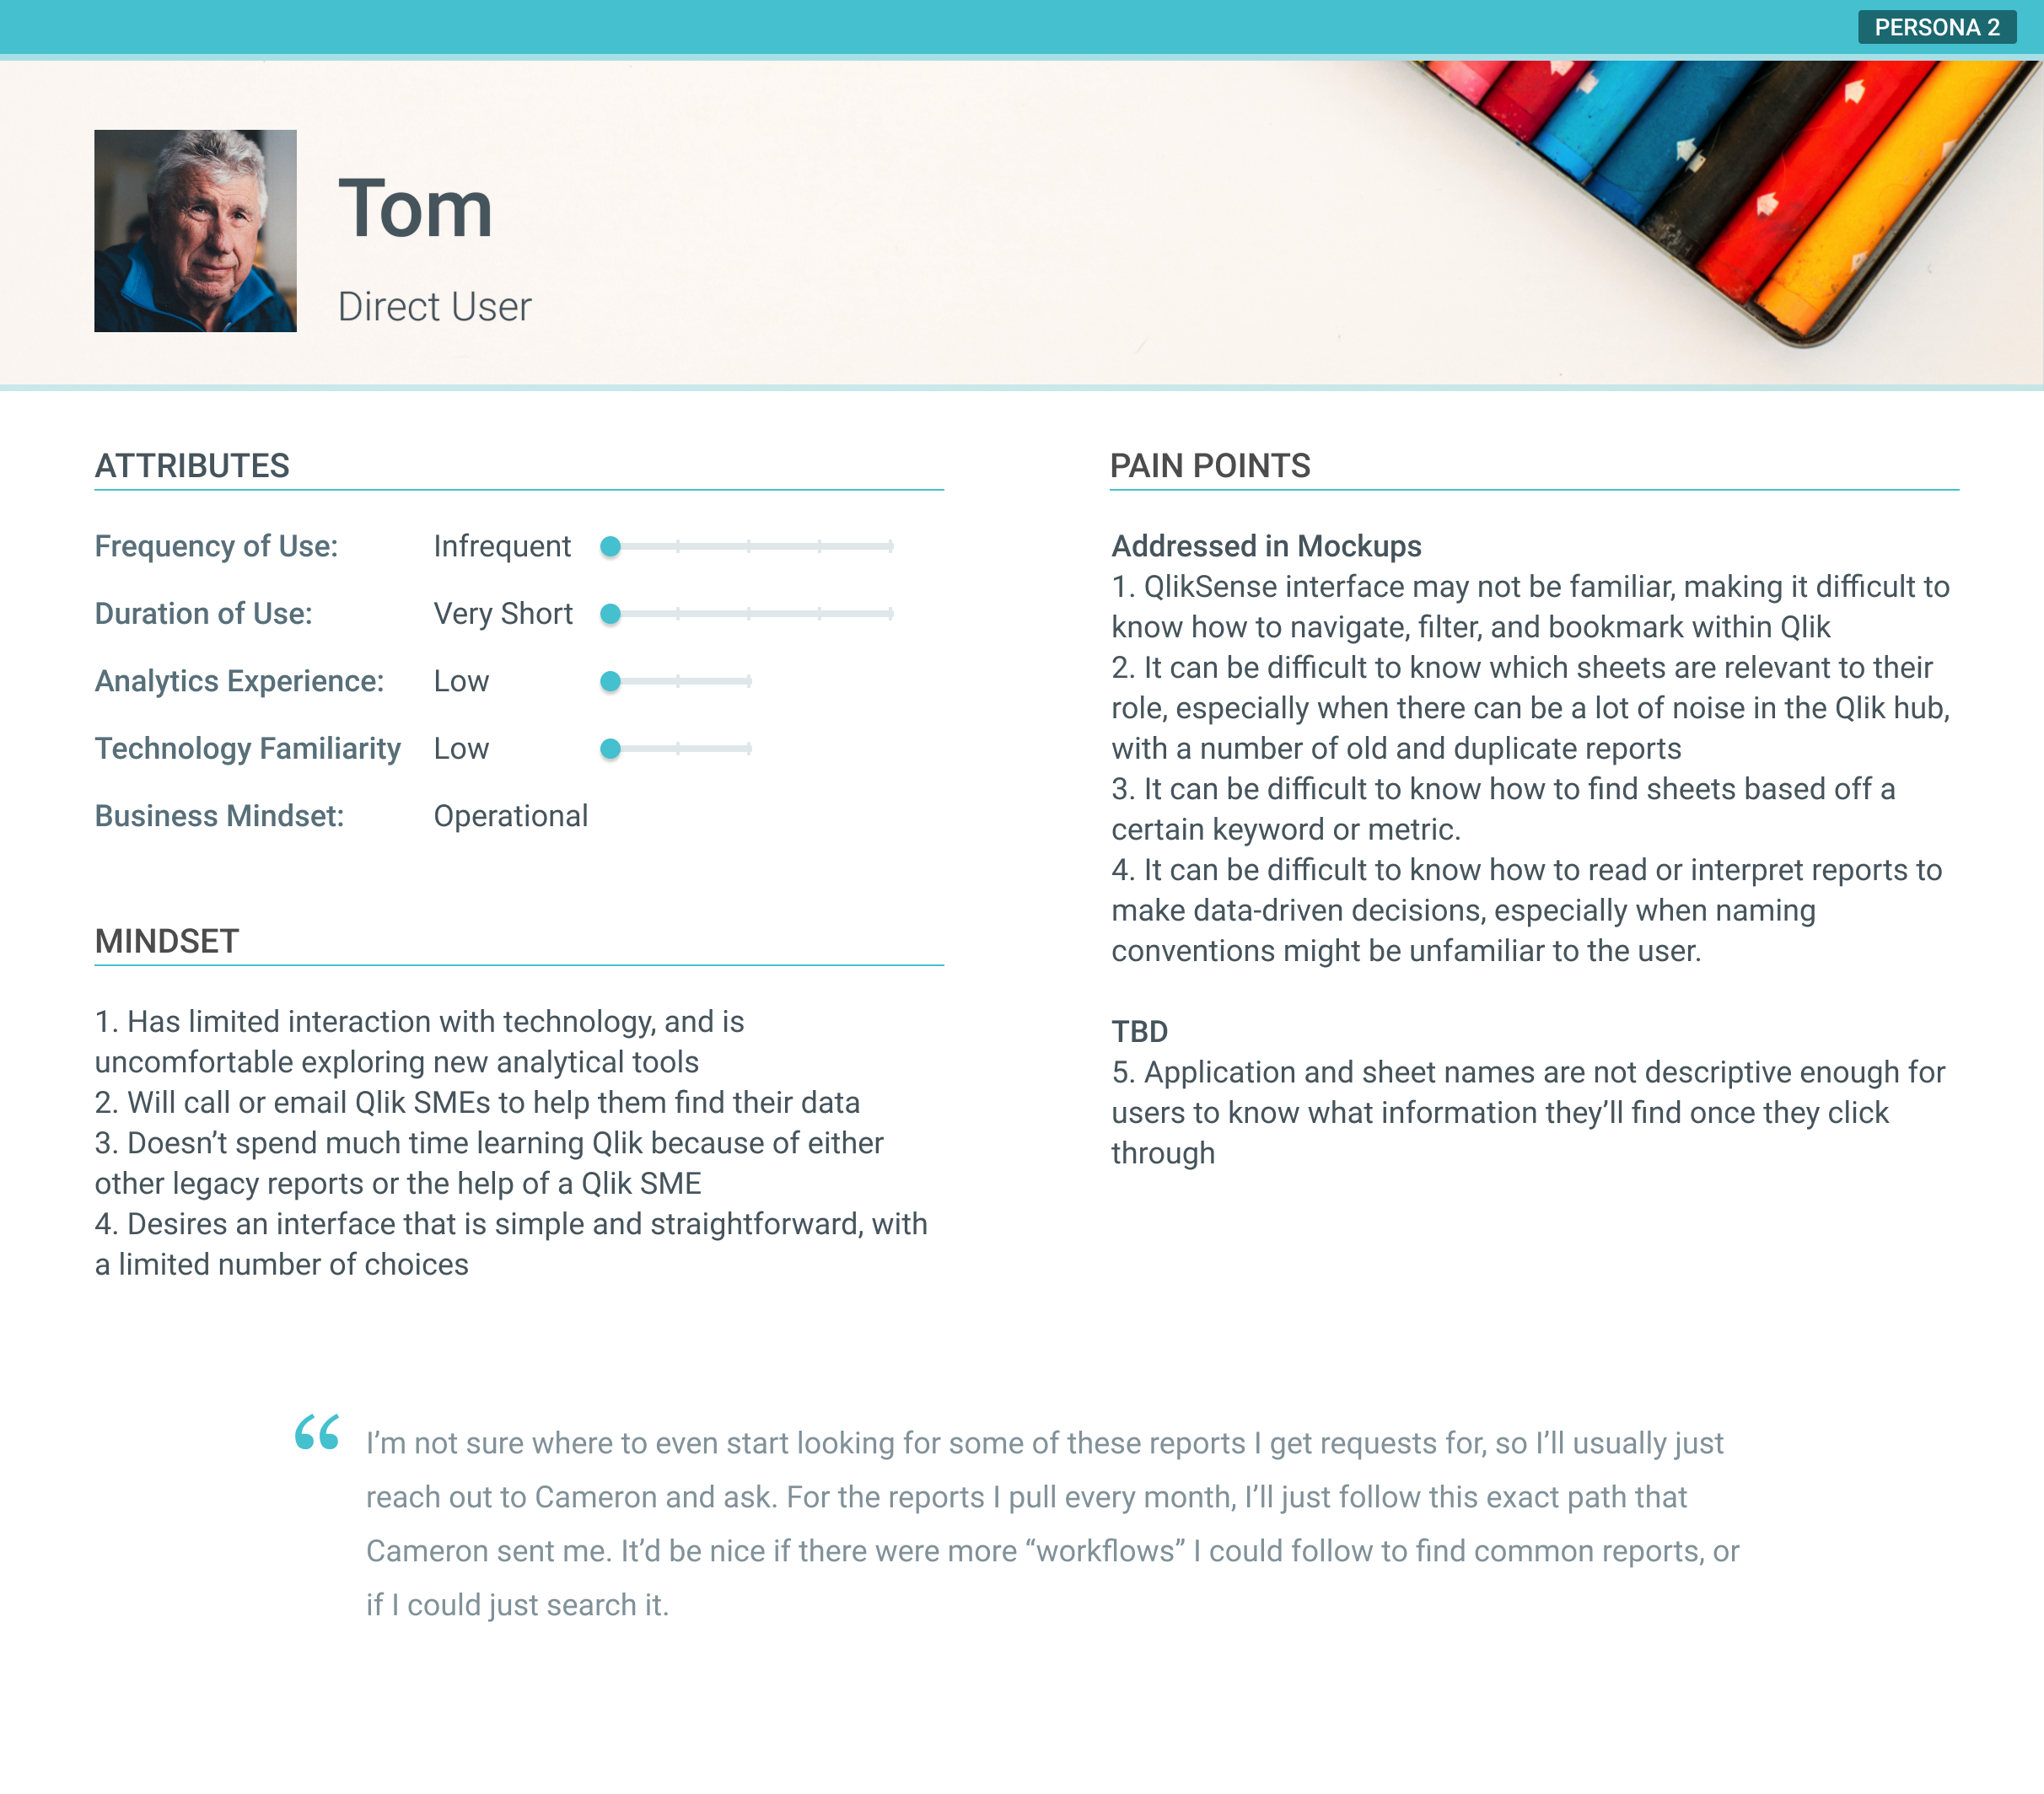
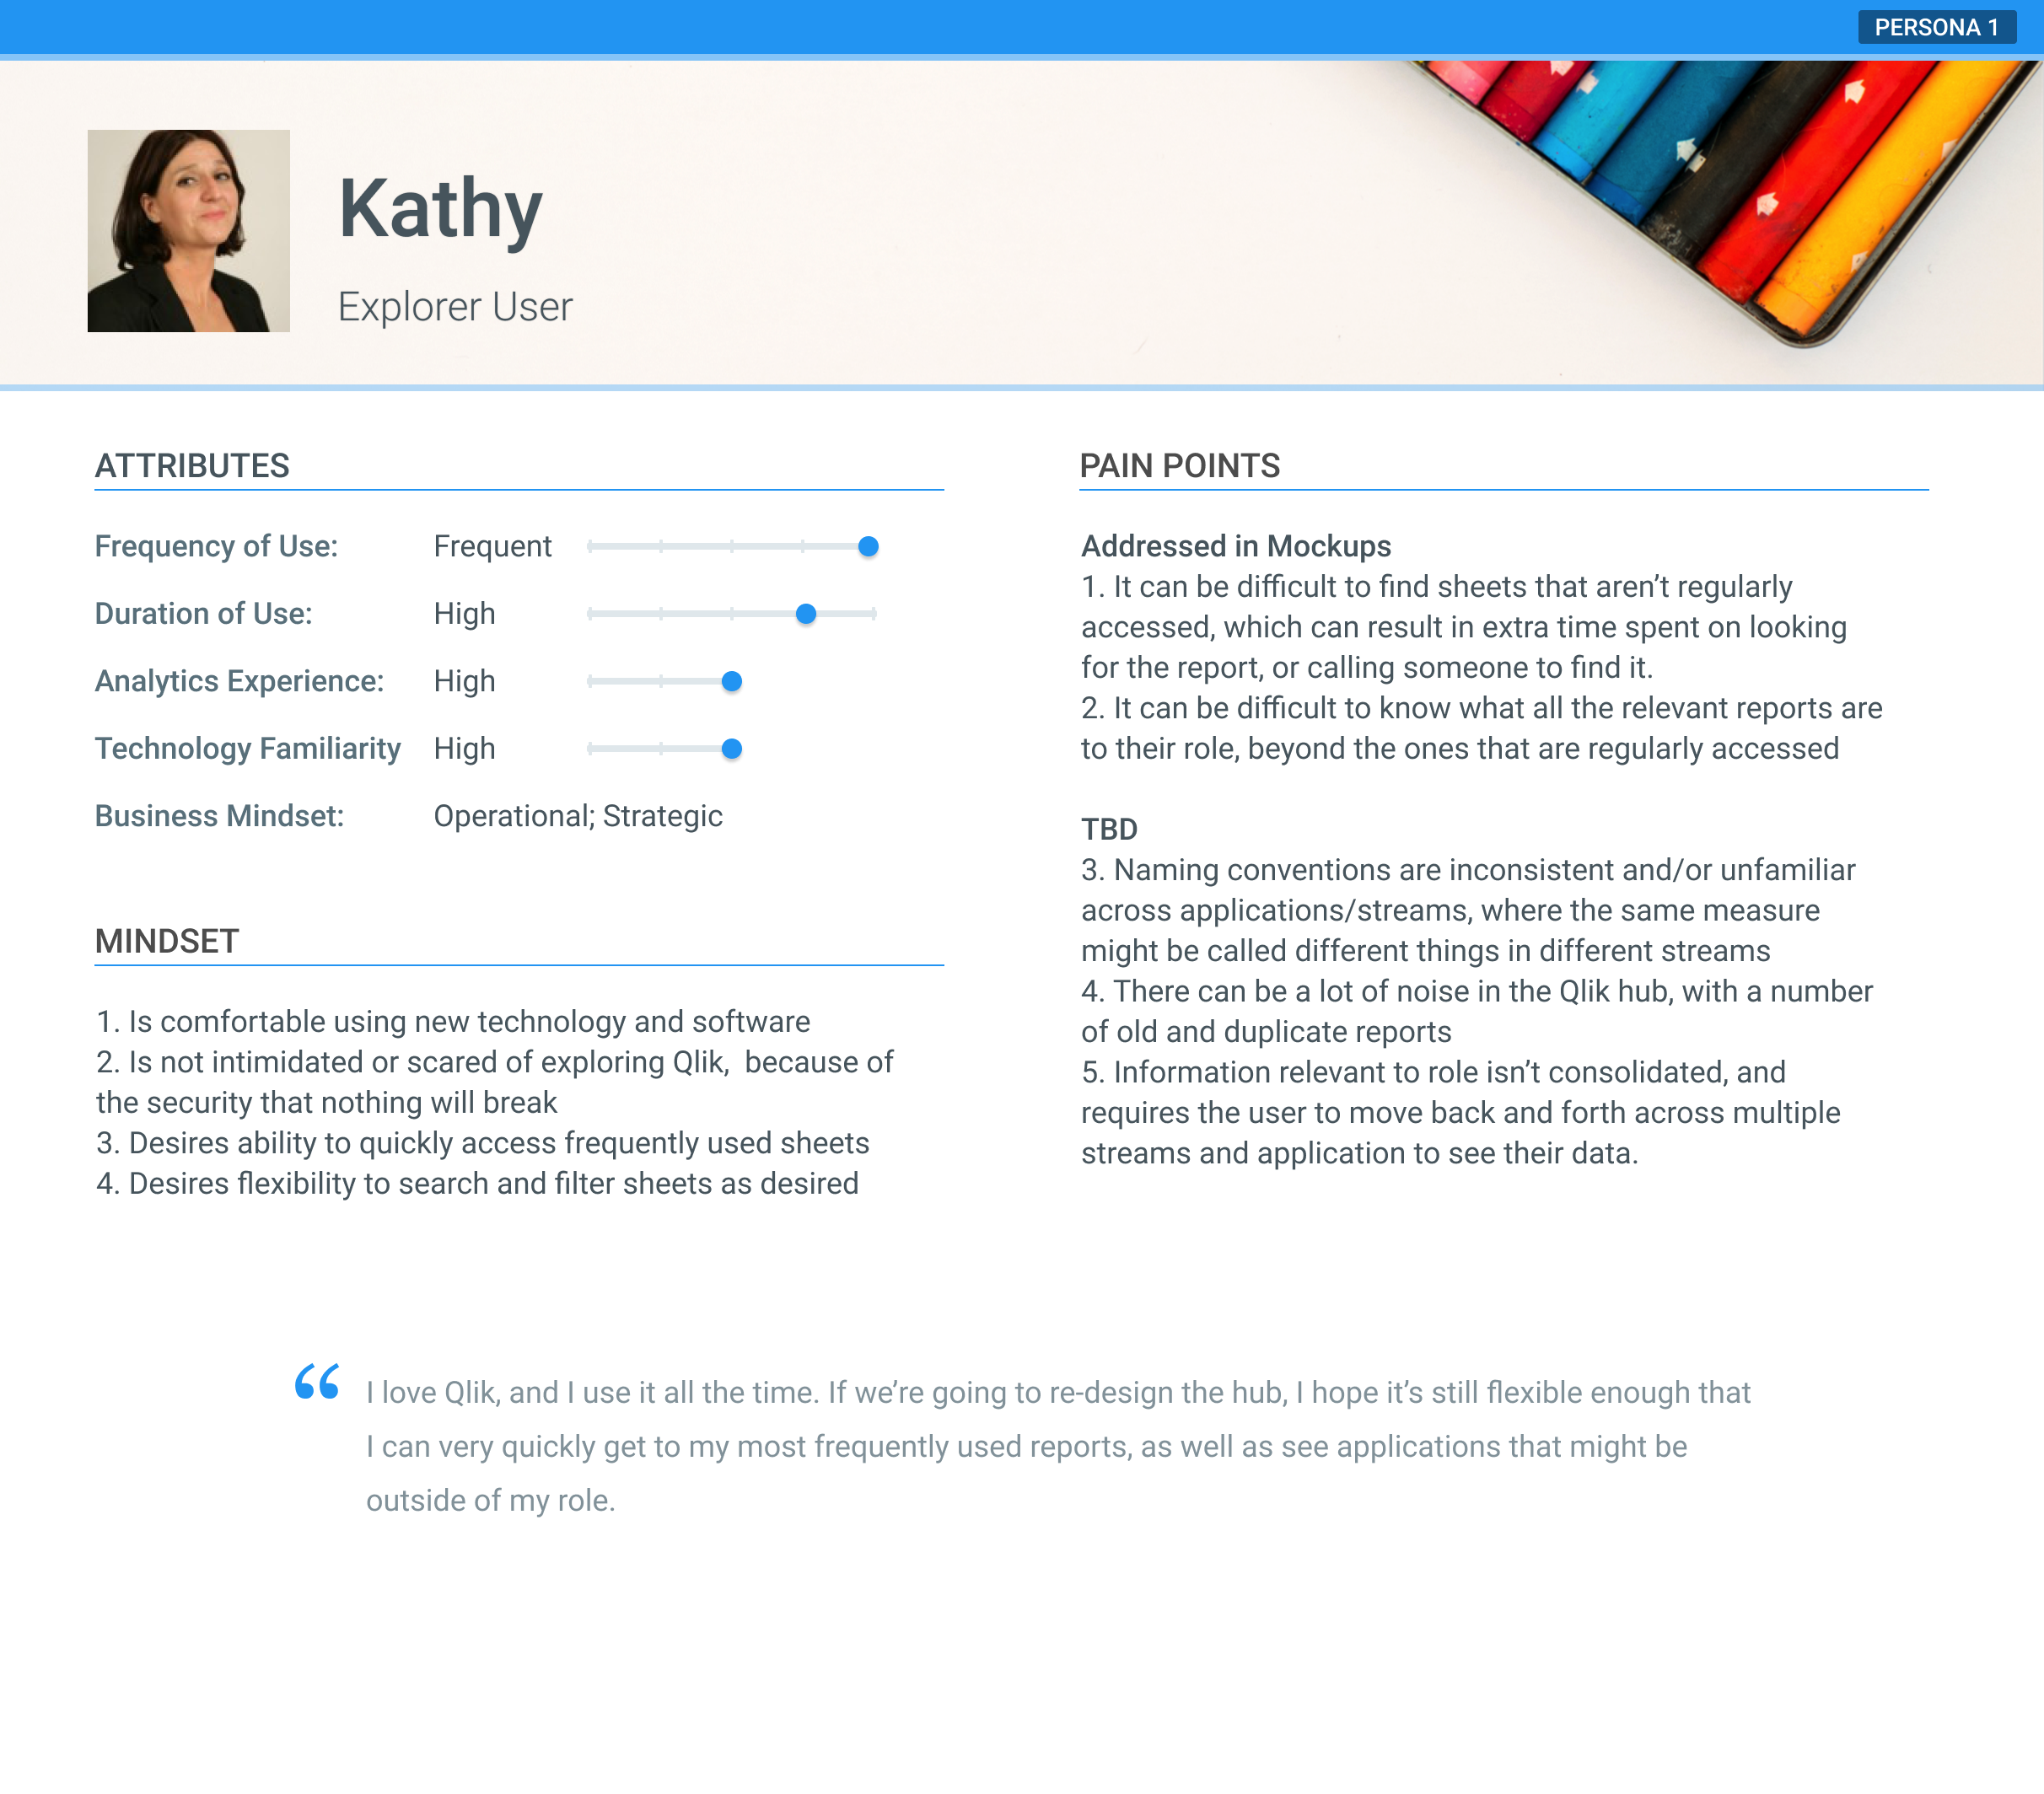
Two main personas came out of the research: the "direct user," or someone who wants a straightforward interface that enables quick access to a set list of reports, and the "explorer," or someone who wants flexibility to explore and discover the library. Something to note about the "direct user" is that they often may not understand how to use the Qlik interface to begin with, and would likely need easy-to-access education resources to get started.
Solution Walkthrough
Below is a glimpse of our solution, which immediately separates the two use cases of "I need to learn" vs. "I'm ready to dig into the analytics."
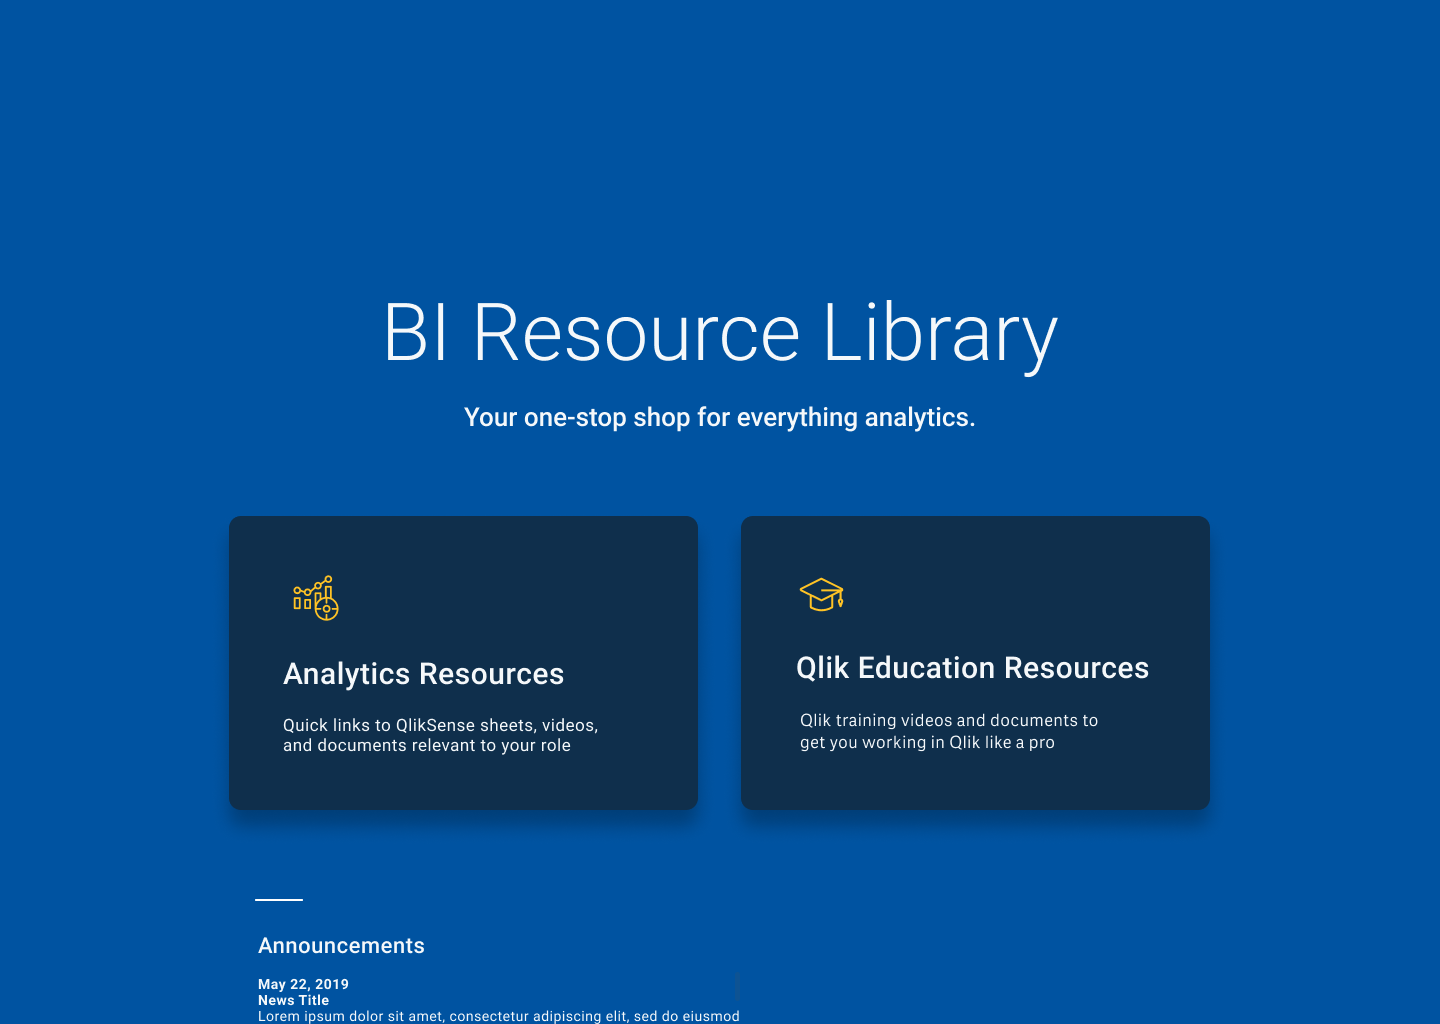
The Analytics Resources page is familiar to a google search page, with quick filters to narrow the list down to role, operation area, subject area, etc.

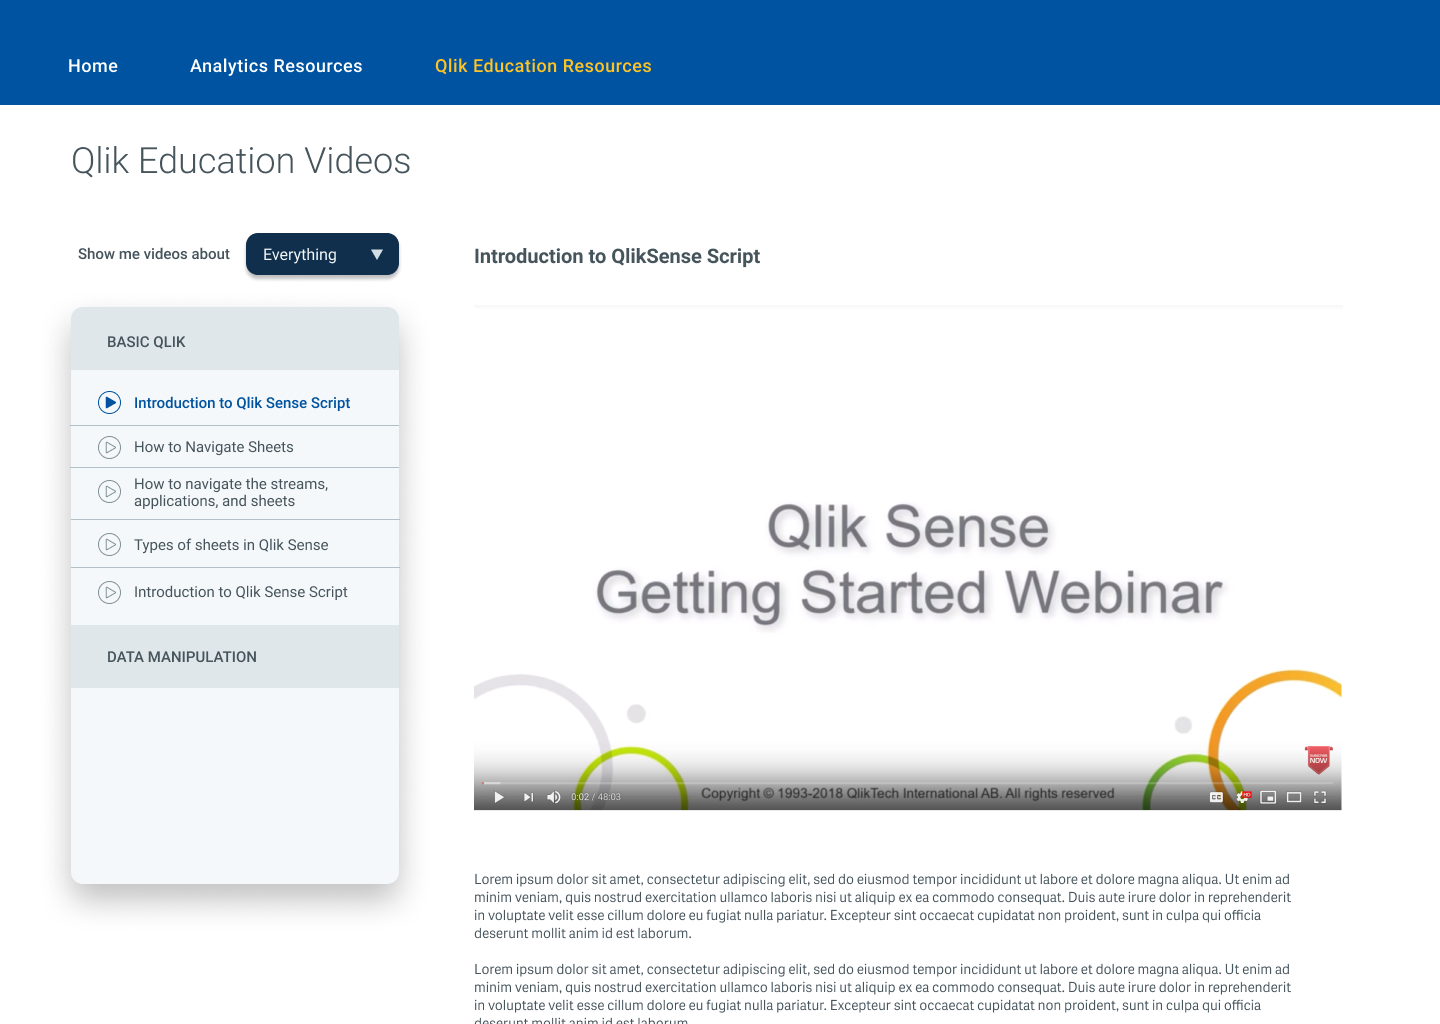
We designed the Education piece to be straightforward and simple, enabling users to stay within the same screen to learn. The layout also mirrors the Analytics Resources page.
JESSIE LIAN
Let's make meaning together.