Visual Analysis of Boston's Building Emissions Data
The Challenge
Axis Group's submission to the 2018 Qlik Qonnections Hackathon.
Boston city officials, building owners, and residents didn't have a tool that helped them understand energy consumption and greenhouse gas emissions across Boston’s large buildings. We had 3 weeks to design and build a solution.
Research Process
We dug through previous Boston emissions reports, as well as other cities' emissions dashboards, to get an understanding of what kind of information people thought were important to distribute and understand. We found that a majority focused on providing benchmark data, analyzing the energy performance of a single building over time, relative to other similar buildings, or even relative to a reference building built to a specific standard (like an energy code).
Two Types of Analysis for Two Types of Users
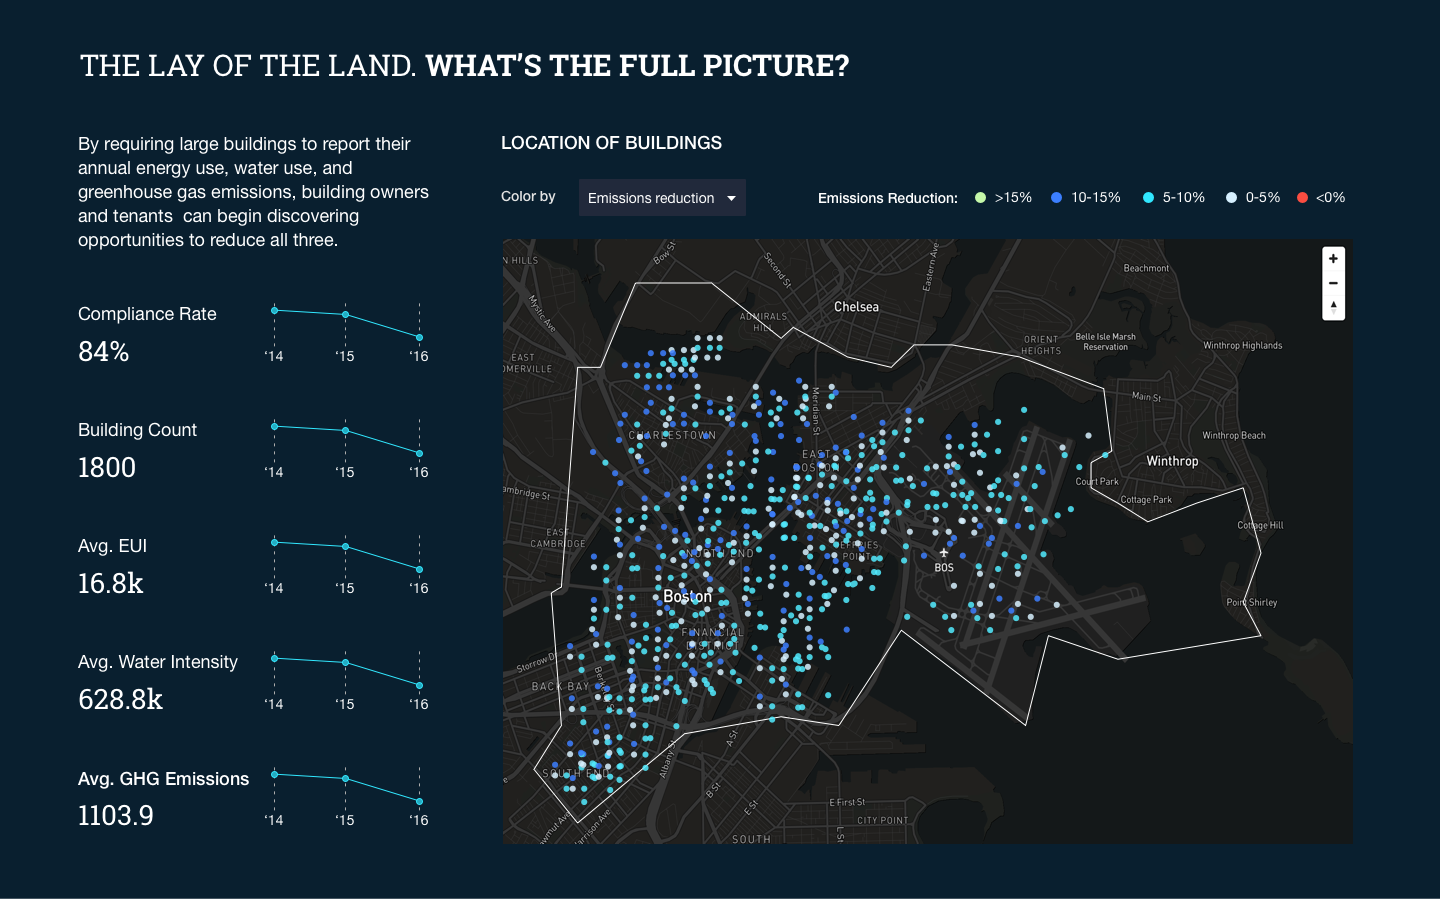
City-Wide Trends and Aggregate Analysis
City officials would be particularly interested in knowing what energy use looks like across different building segments, to identify patterns in both high-performing and low-performing buildings. Building segments in the data included: property type, year built, square footage, years reported, and % to target.
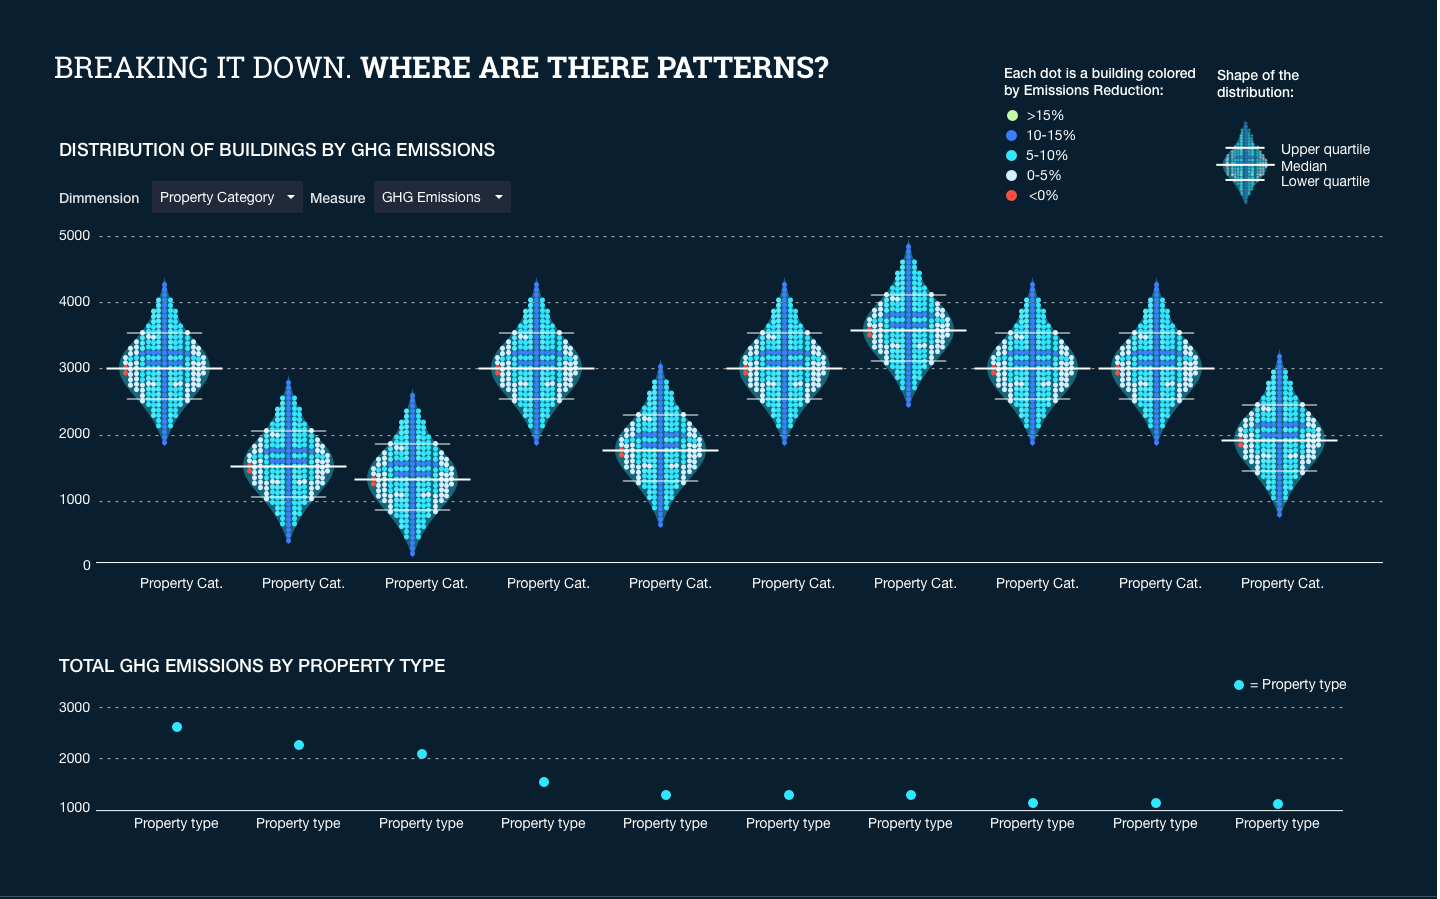
Questions asked in this analysis include:
- Are there energy use patterns in different building segments?
- Which buildings segments are most energy-efficient? Which are least?
- What variables most strongly correlated with this performance?
- Which buildings & building segments are anomalies? Why?
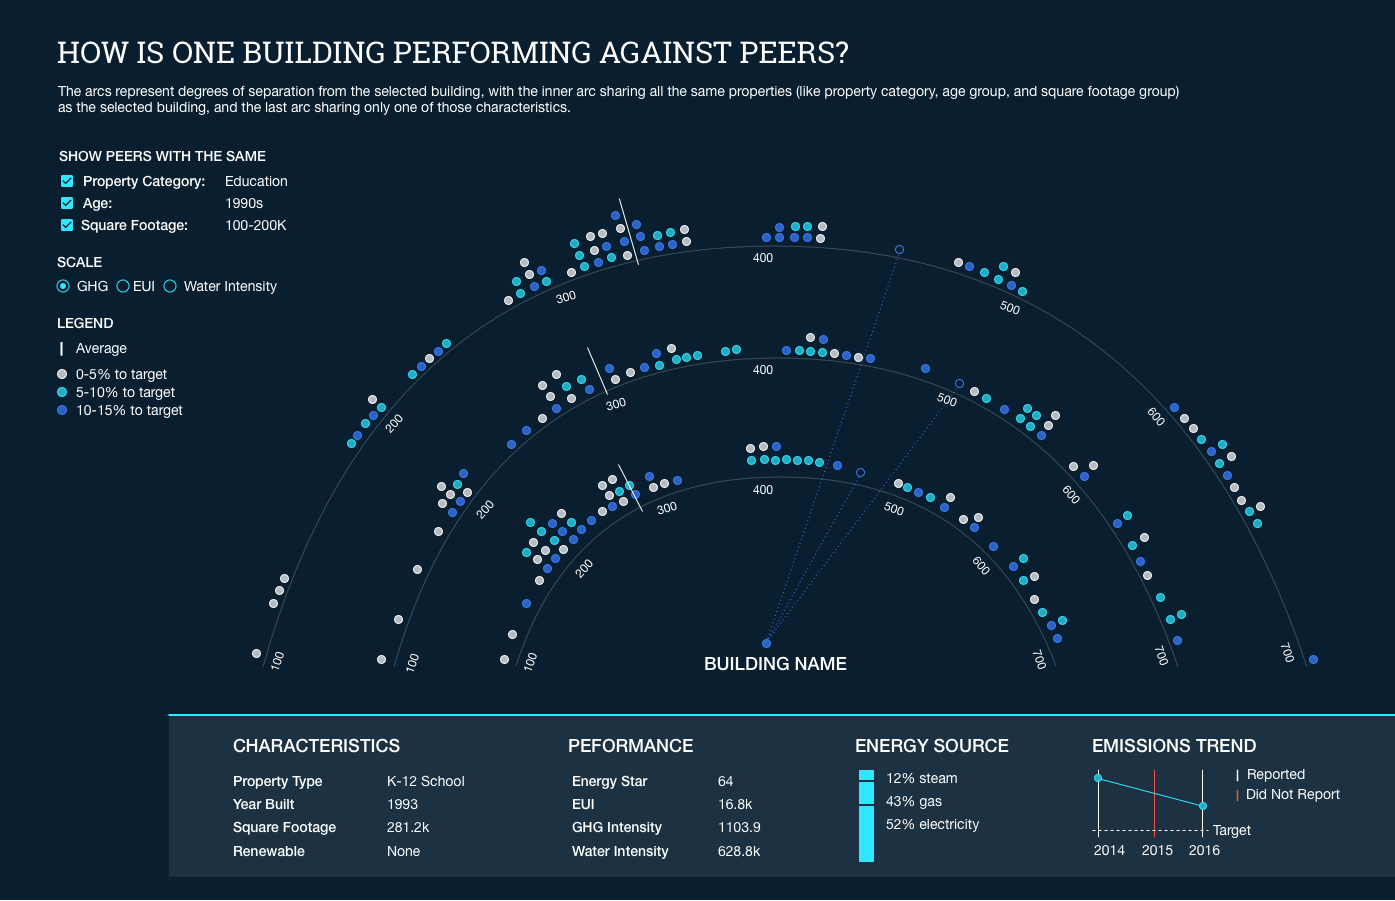
- How is the building performing against peers, or buildings in a similar context?
Building-Level Reporting Assessment and Analysis
Building owners, on the other hand, would want to know how their own building is performing, and how it compares to peers. City officials may also want to look at individual buildings to help them identify buildings to analyze.
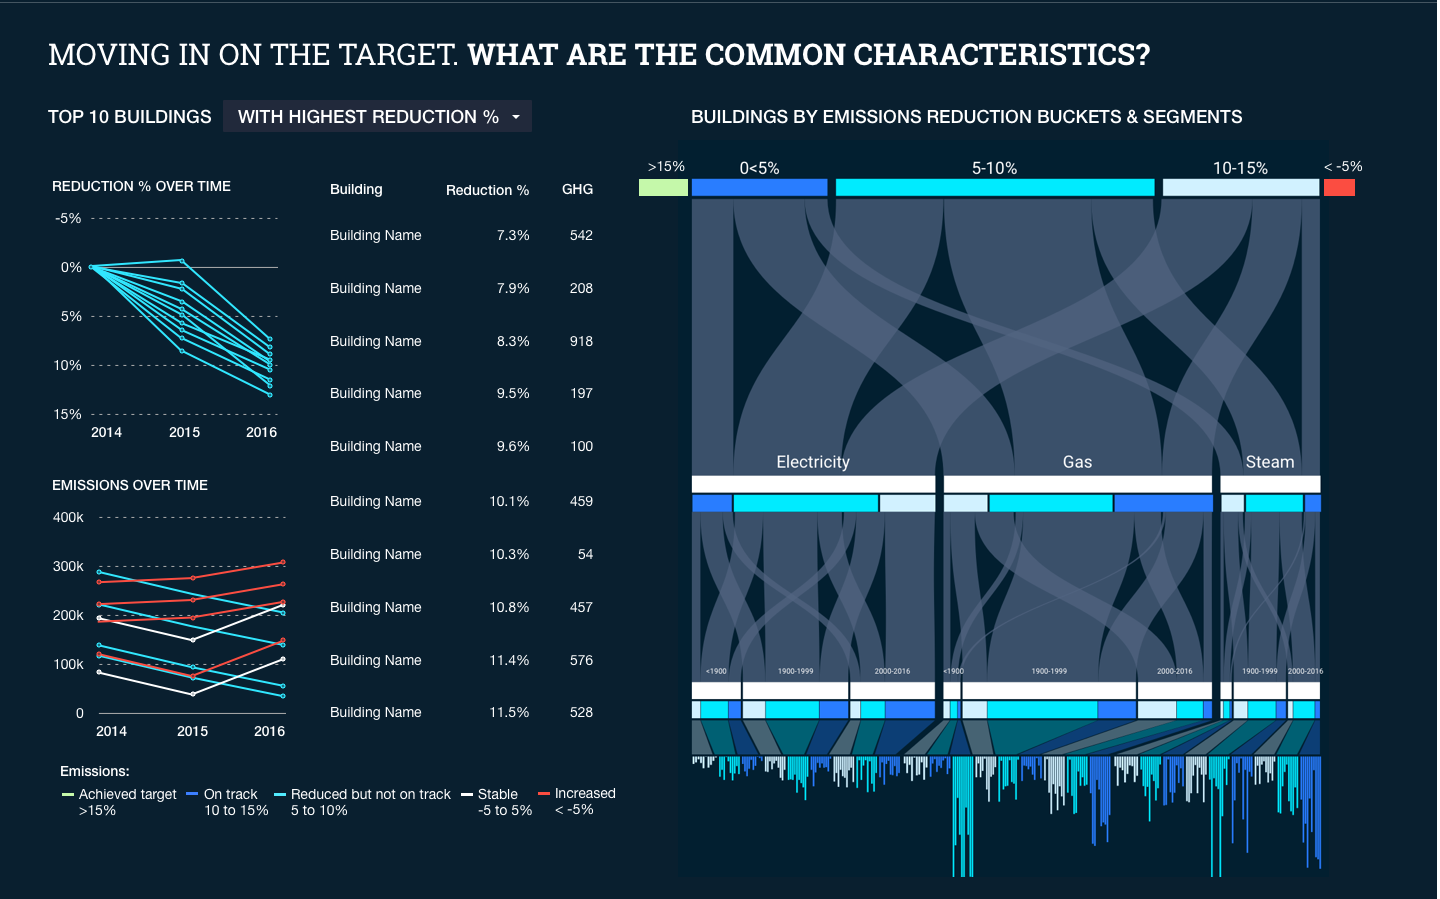
Questions asked in this analysis include:
- How is the building of interest performing?
- Did the building report data? Over what period?
- How is the building performing against the 15% reduction target?
- How is the building performing against peers?
- Which buildings are performing the best against the 15% reduction target?
- Which ones could use additional support?
Iterating toward more creative data viz...
Since it was a hackathon, our team took the creative liberty to explore different data viz possibilities. We ended up coming up with 3 new charts (well, really just a combination of other charts, but still!), which you can read about here.
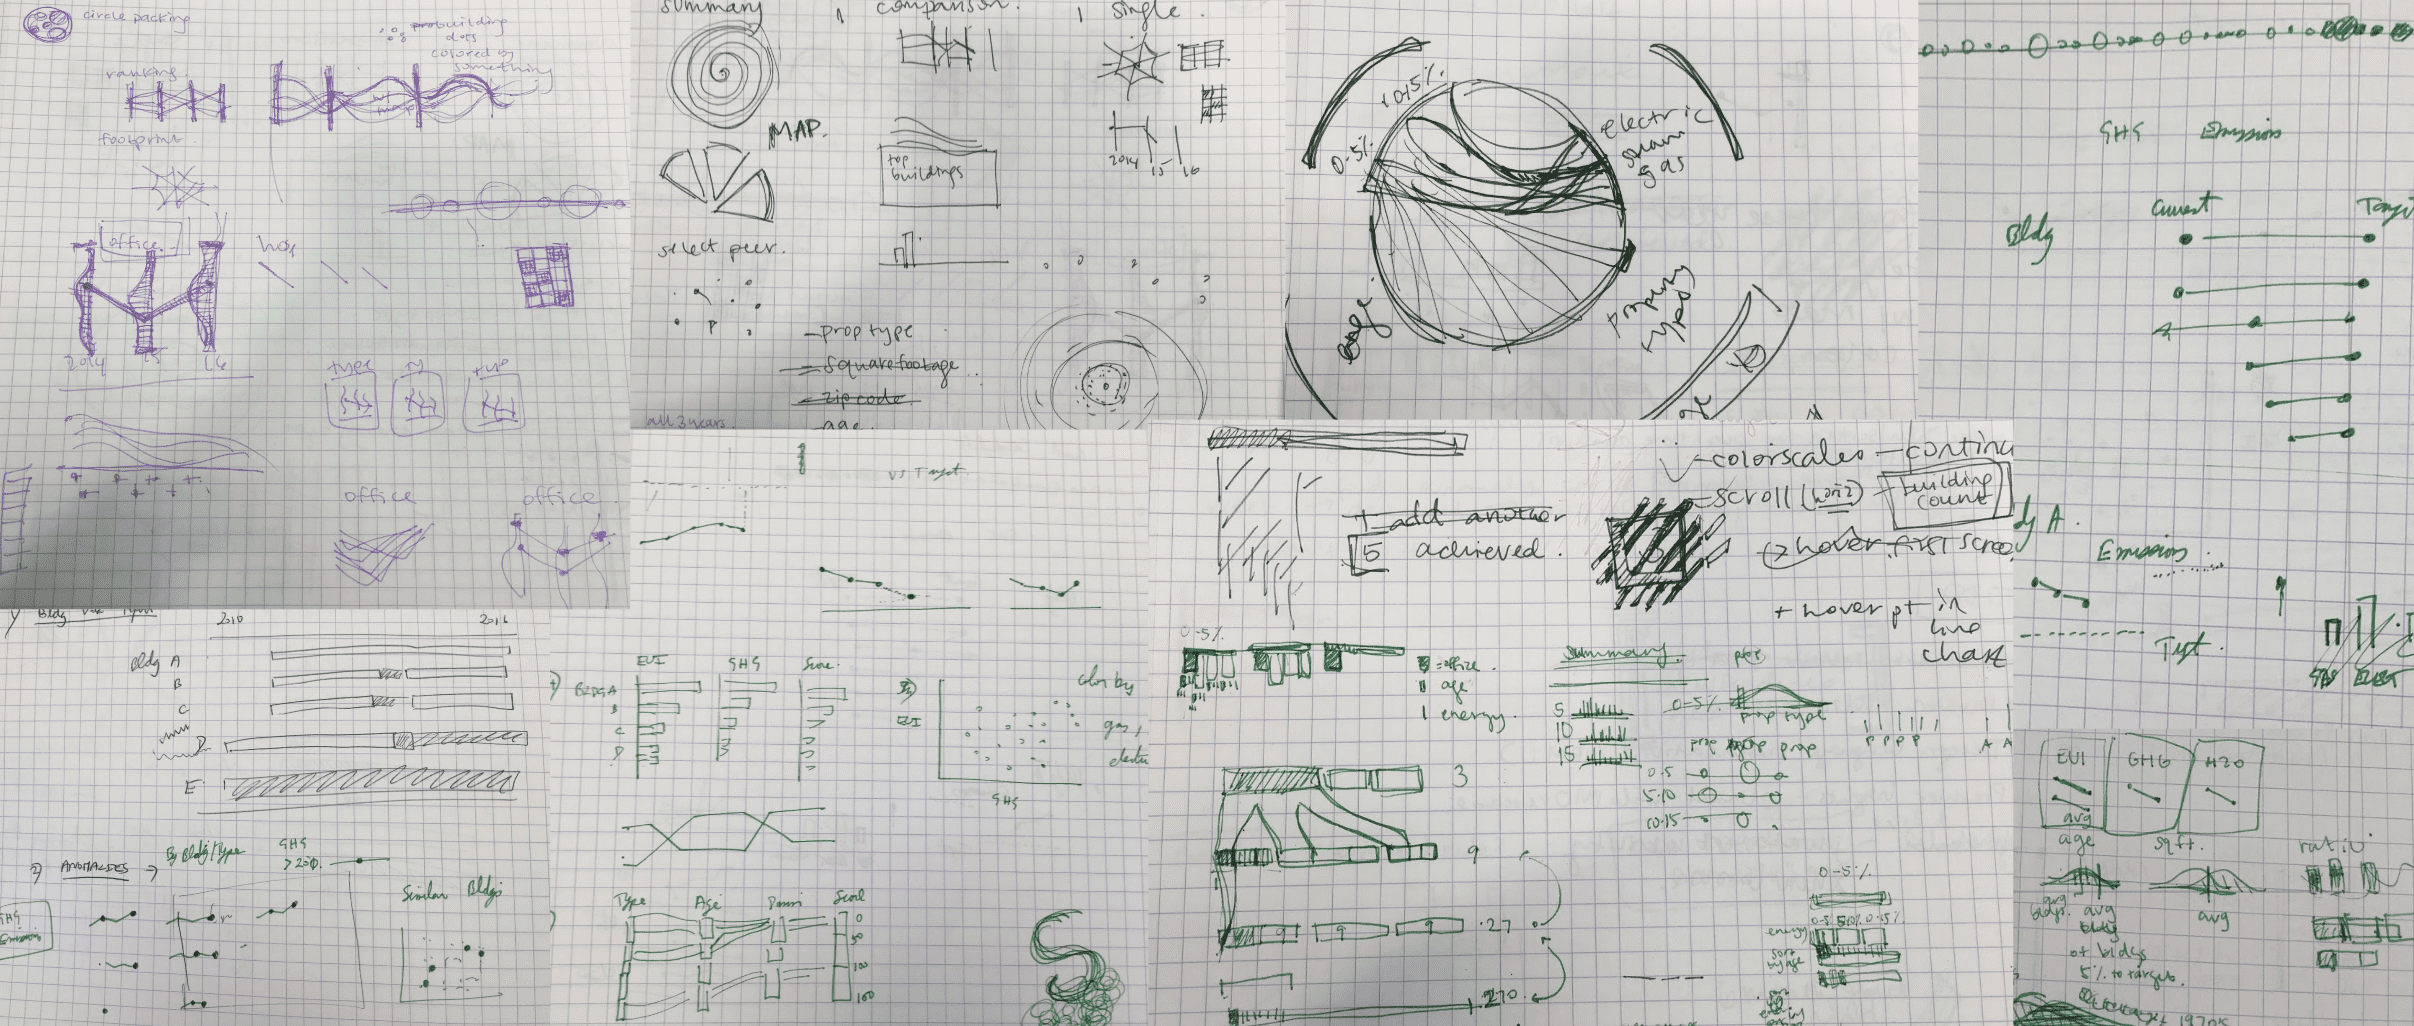
After some enthused and eager brainstorms...
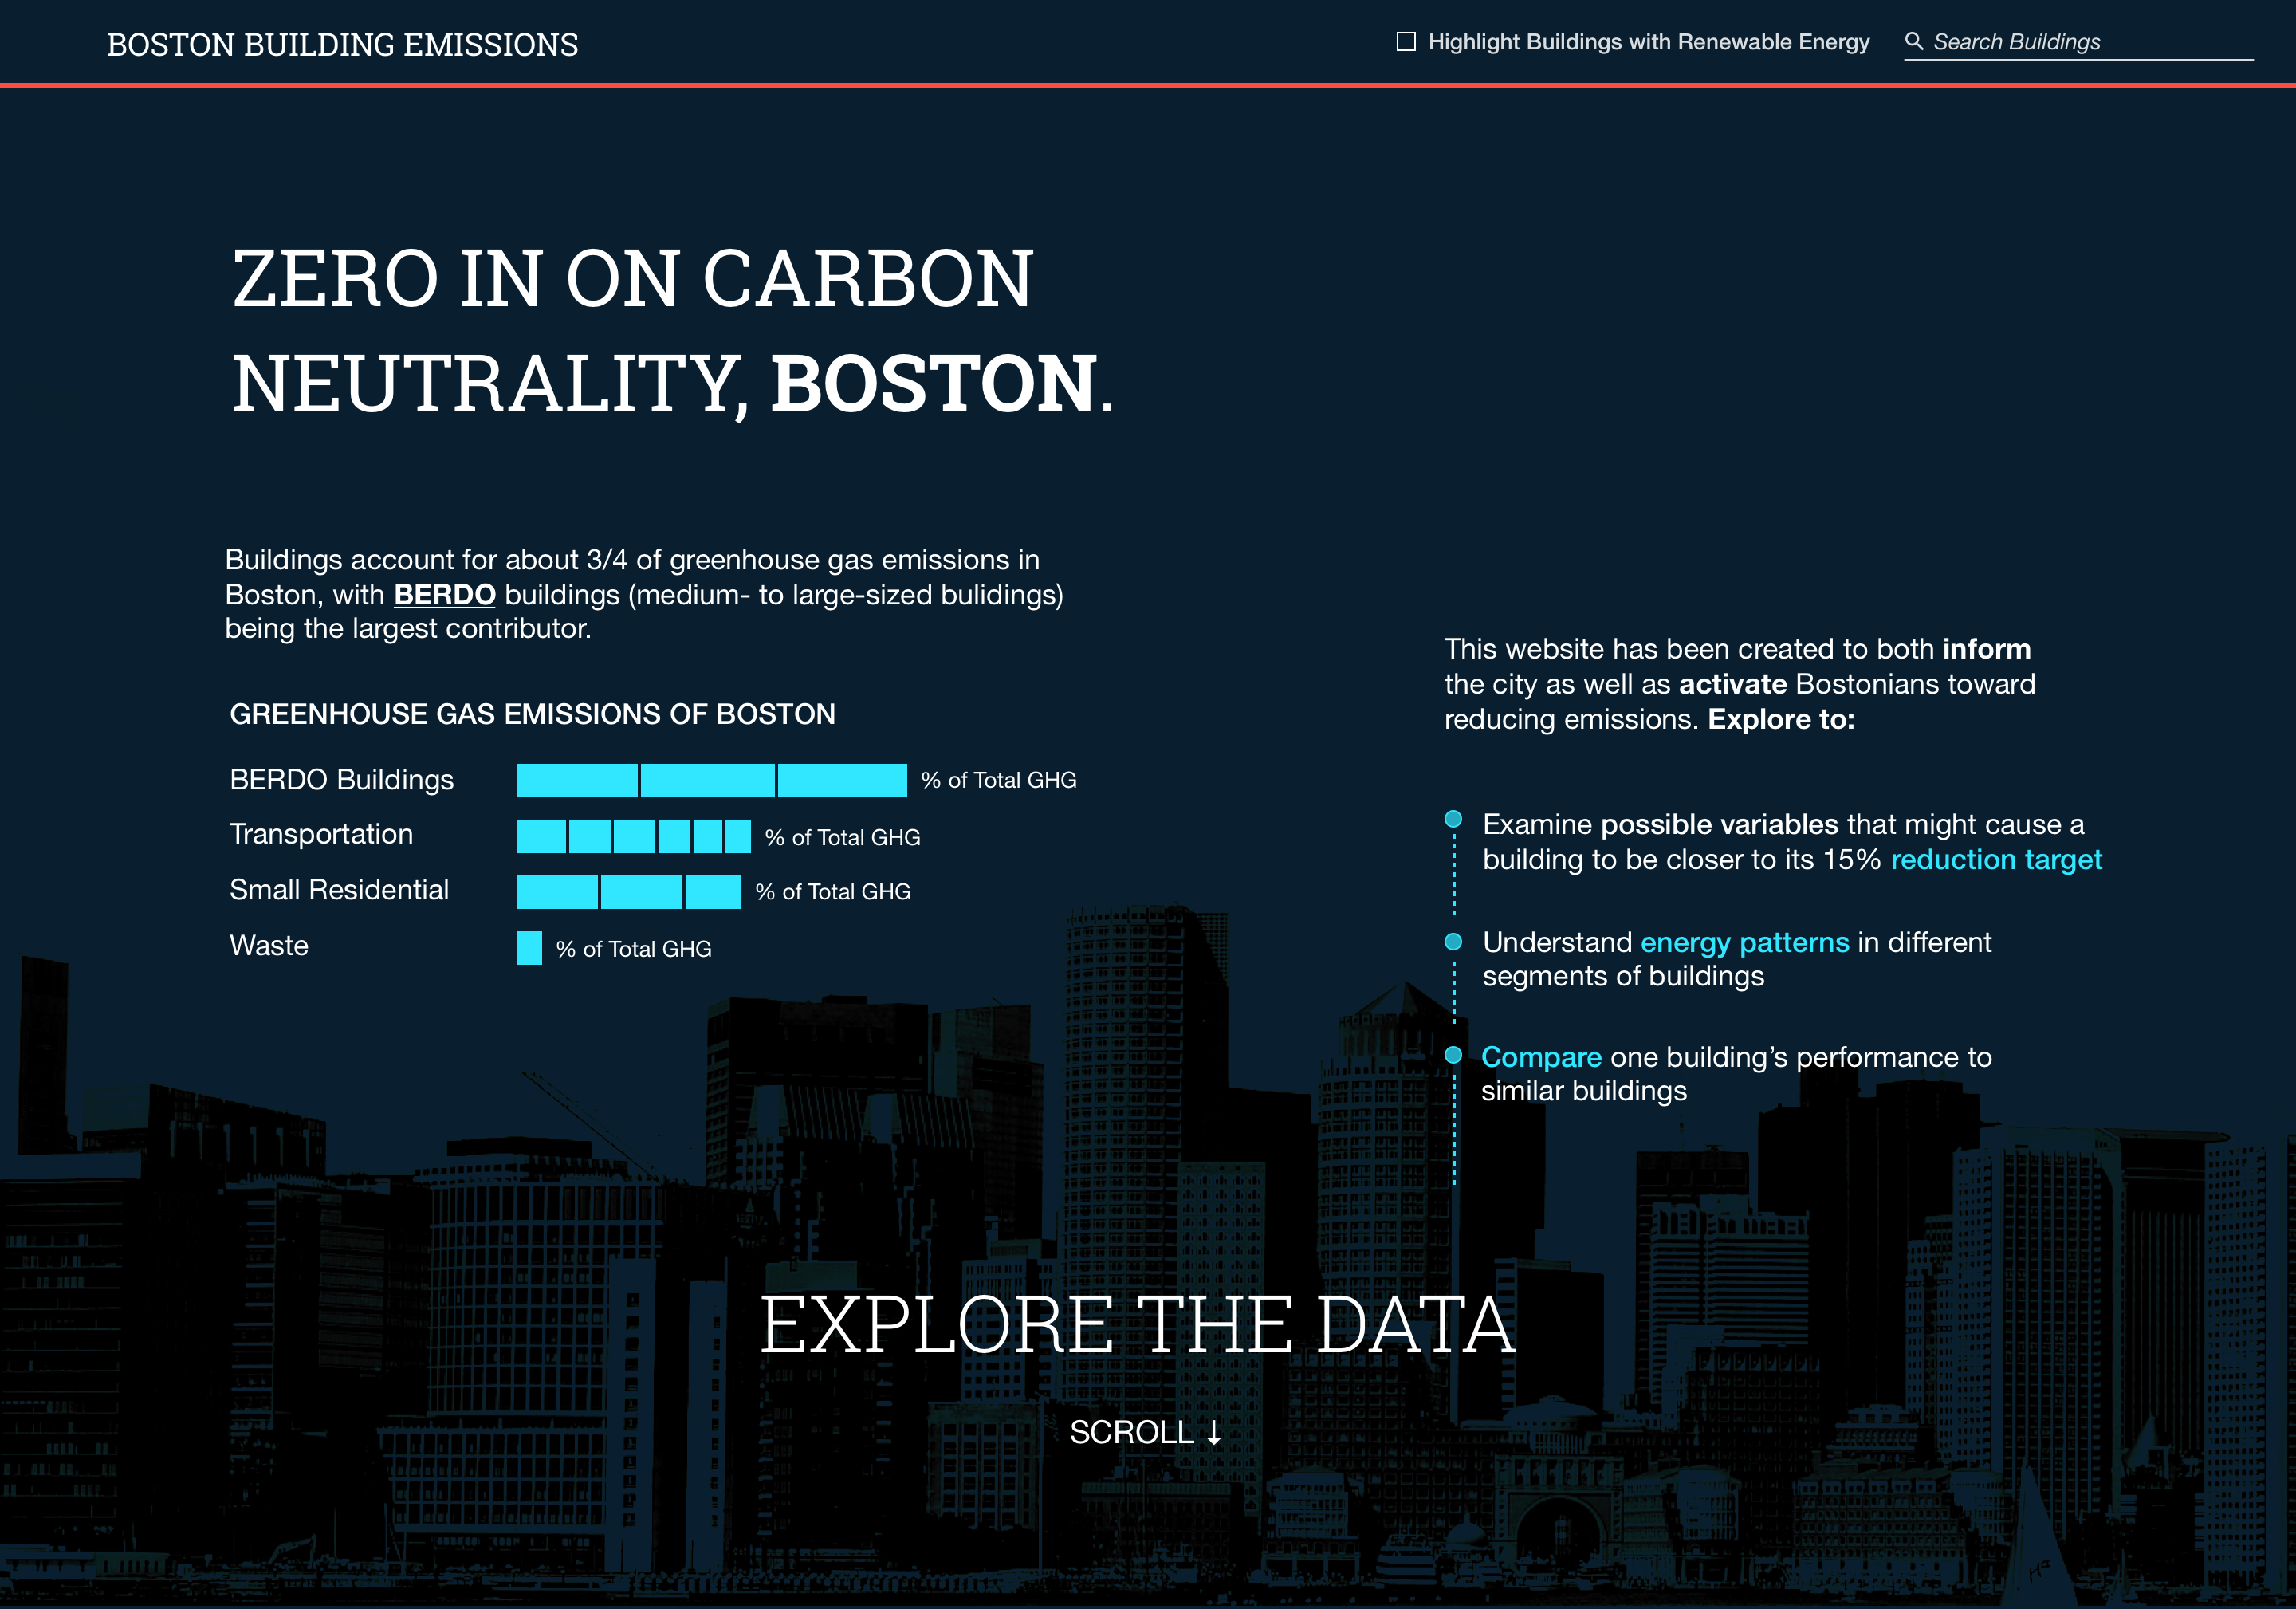
We landed on a scrolling page that starts out with high-level performance metrics, then zooms down to a single building analysis. We wanted to both inform and delight, hoping that the interesting visualizations could intrigue while also provide insight, whether it's by identifying patterns & outliers in different categories (i.e. property type, year built, square footage), seeing how different categories tracked to target, or comparing one building to similar "peer" buildings.
JESSIE LIAN
Let's make meaning together.