Metro by T-Mobile:
Empowering a Sales Team to Self-Evaluate via a Refreshed Analytics Experience
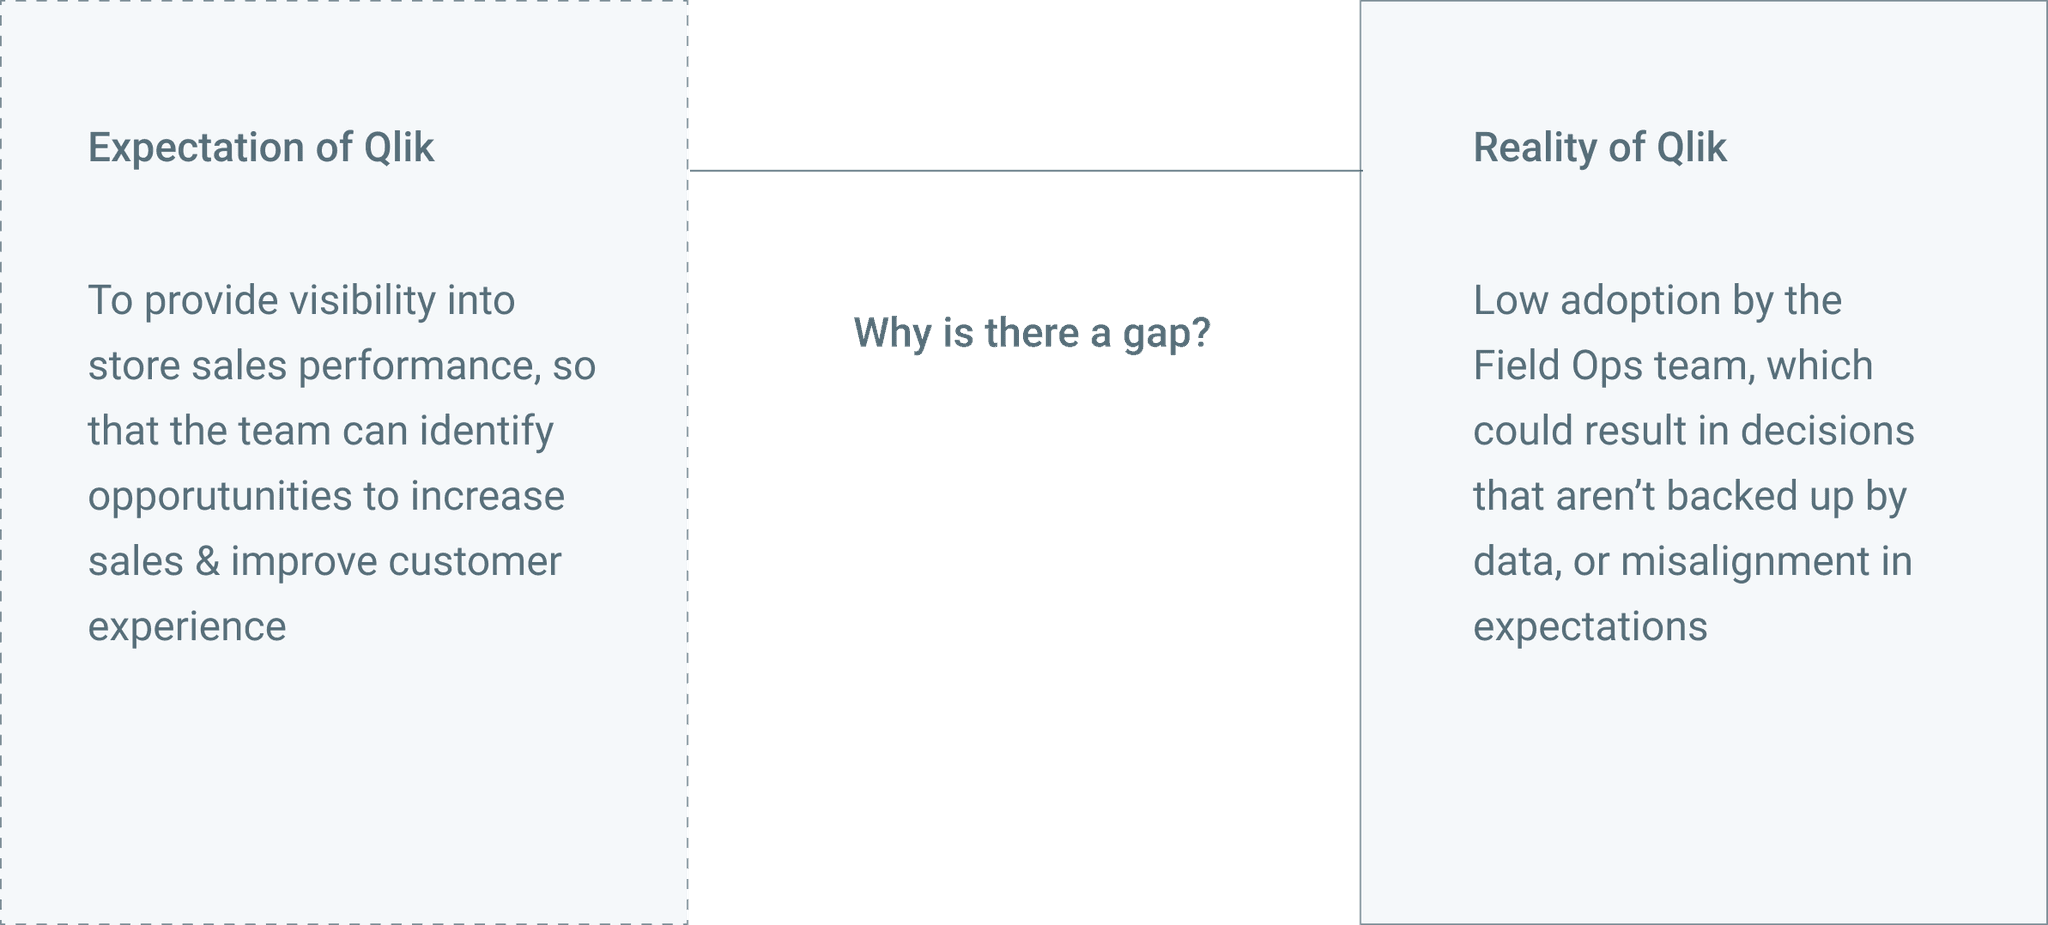
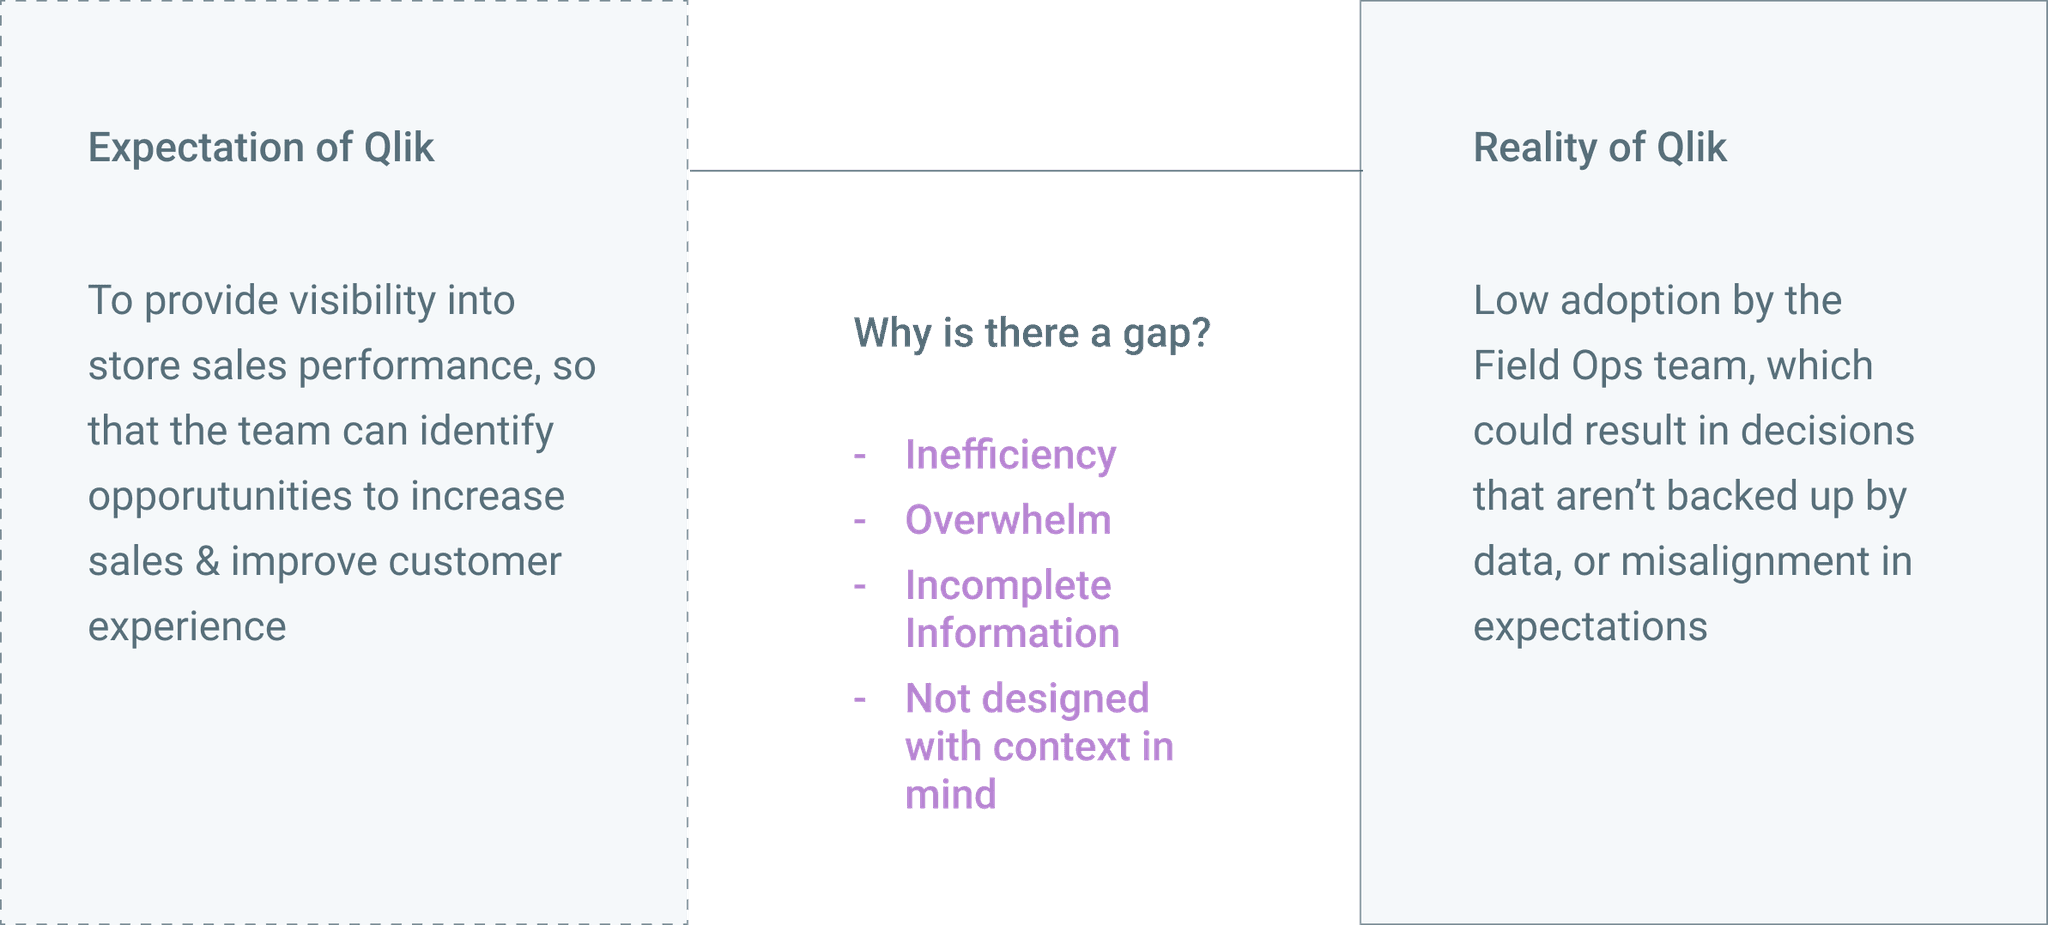
Problem Statement:
The Field Ops team wasn't utilizing the full functionality of Qlik, their resource for all things analytics and BI dashboards. This was preventing them from performing thorough self-evaluations that could help increase store sales performance.
Note: Qlik is an out-of-the-box dashboarding software
Research Activities:
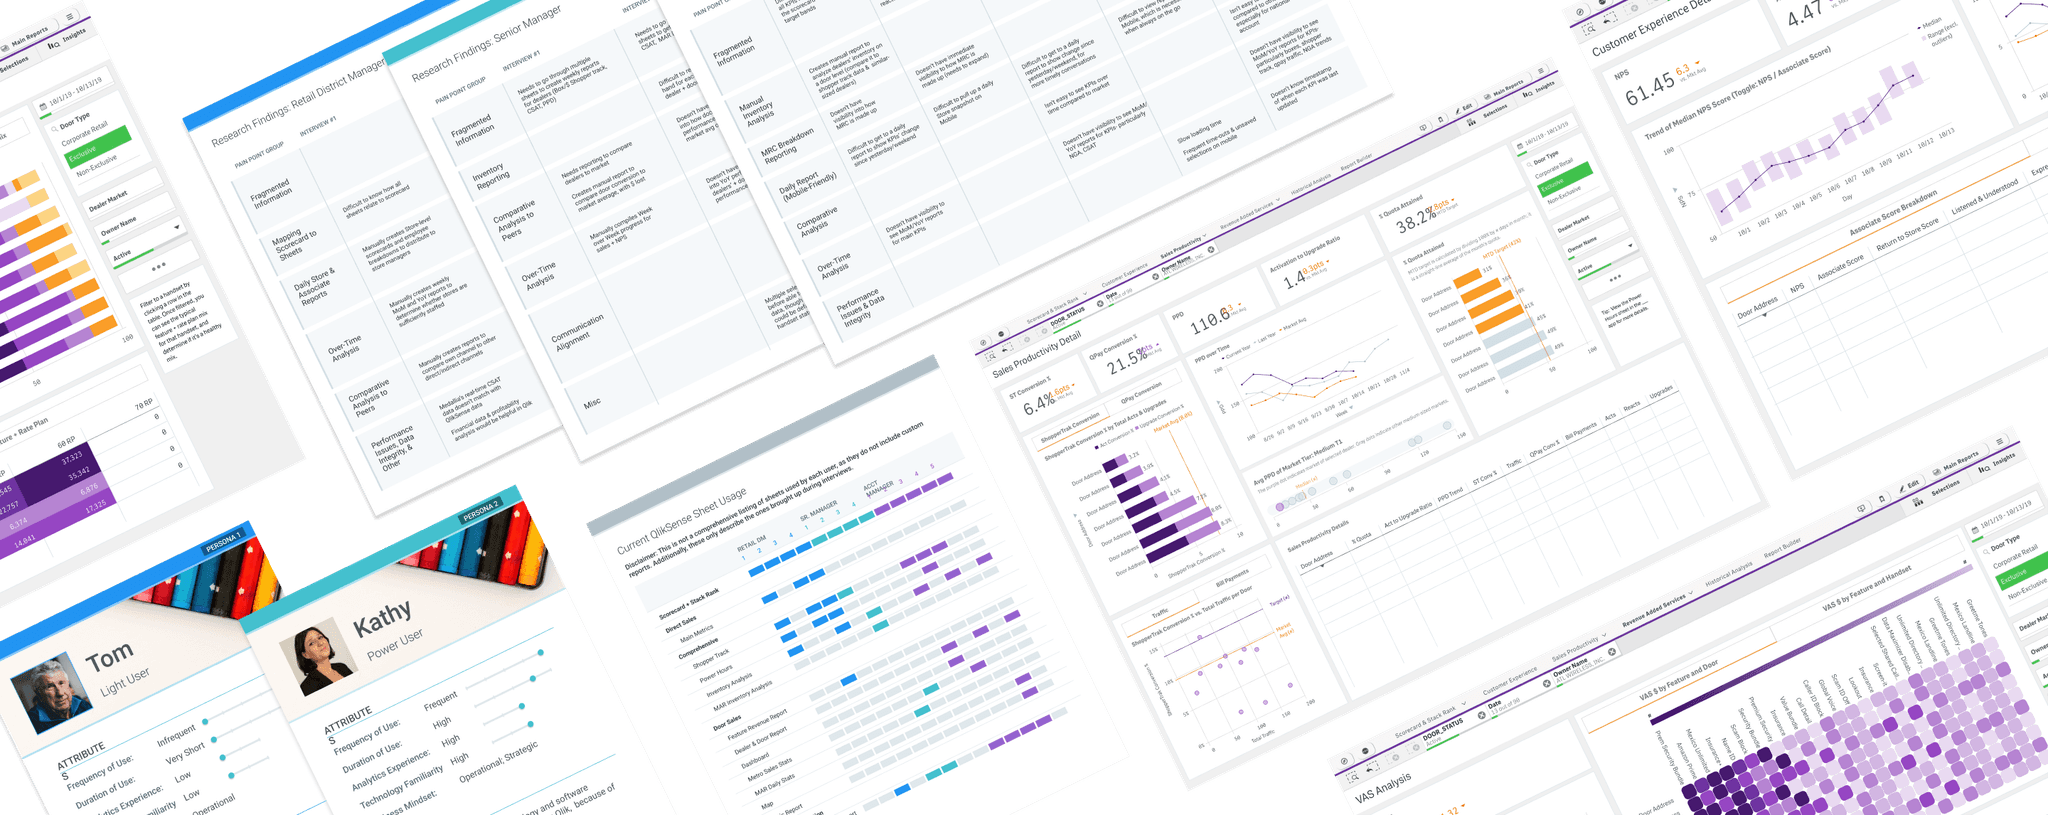
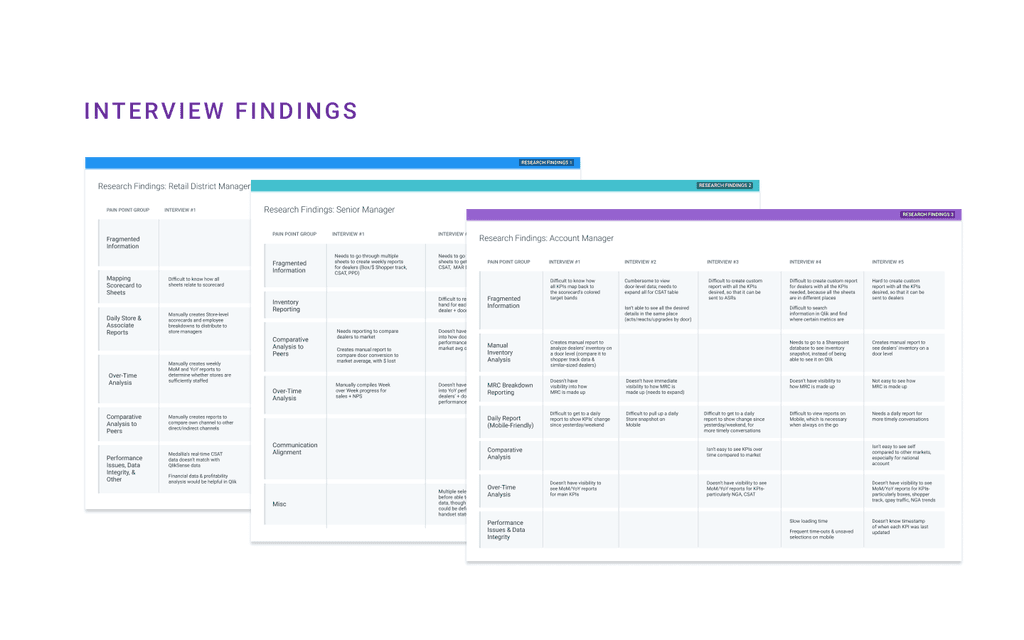
23 Interviews across 2 Channels & 6 Job Titles
Interview objectives:
`1. Learn about the differing goals and responsibilities of people in Field Ops
2. Understand how Qlik supports their goals and tasks
3. Observe how they’d normally use Qlik in a typical session
4. Identify pain points in the current process
Defining Personas & Mindsets
I defined personas to answer the questions of how we could make the available information more complete and relevant, and I defined mindsets to understand how we could make the user experience more efficient, less overwhelming, and more designed for context.


Auditing Current Applications
I conducted an audit to understand what were the most frequently used sheets, and whaat were the common metrics found on the most frequently used sheets.


So, back to the problem statement…
Creating Solutions
ONE.
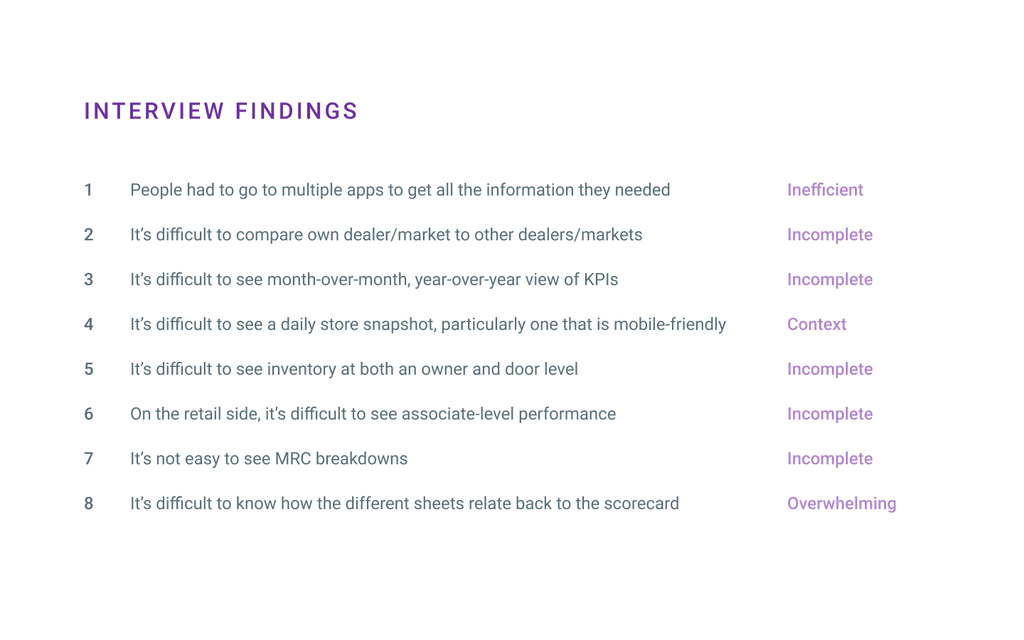
Because users had to visit 3-5 different applications in one session to get all the information they needed, and because everyone had different metrics they needed to see, I recommended a single application that consolidates all the main use cases & a report builder to allow people to create custom reports.

TWO.
Because users didn’t know how all the reports related to the 9-10 key metrics on the Scorecard (the report used to evaluate their overall performance), I created clear navigation categories that tie back to the Scorecard, with supplemental sheets that provide detail analysis into the 9-10 key metrics.


THREE.
Because important analyses about sales performance weren’t made available, I designed a revamped dynamic scorecard to enable peer comparison & newly designed reports to allow for the analysis needed for informed decision-making.


FOUR.
Because the team wasn't able to quickly reference reports on their phones when on the go and making field visits, I designed a mobile-friendly report to provide a single store snapshot.

Continued Iterations
After re-designing a new analytics experience, I conducted user feedback sessions, individual testing, and sent out a feedback form. This helped me to refine measures & filters for more actionability & relevance, increase clarity around language & functionality, and increase the overall delight of the experience.
A few lessons learned:
1. Starting with open-ended research questions can create better products
2. Surveys & group/solo interviews could have been more strategically used
3. Performance matters. Design needs to be flexible to efficiency demands
Want to know more?
Please contact me for a more thorough walkthrough of this case study.
Thank you for reading!